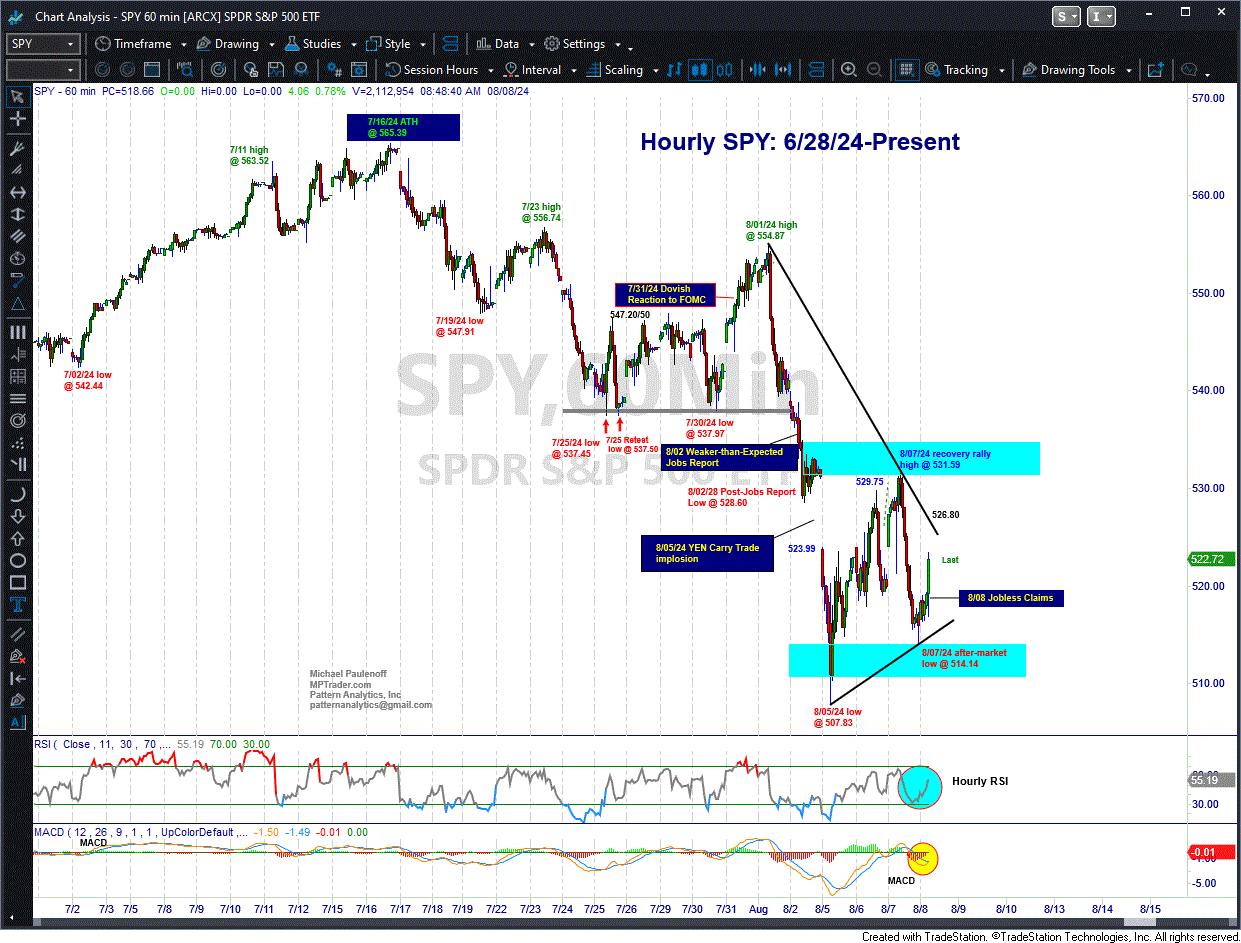
Hourly Chart On SPY
From the perspective of SPY, the turquoise blue demarcation boxes on my attached Hourly Chart delineate what my pattern work anticipates is the dominant developing range between 510/514 on the low side and 530/534 on the high side for the upcoming sessions ahead of next week's PPI and CPI inflation data (Tues. and Wed.).
In the interim, however, we might have to deal with stories-- real or imagined-- about waves of Yen carry-trade unwinds to "complete" the process that emerged this past Monday. From what I have been reading, JP Morgan estimates that the size of the carry trade unwind is $4 trillion, and that "only" 60% of the projected unwind has been satisfied so far!
The moral of the story, after this sideways rangebound and/or recovery rally period runs its course, let's expect ES to roll over toward 4900-5000 and SPY to 490-500, probably in reaction to a catalyst that triggers the next wave of carry trade selling pressure... Last in SPY is 522.60

