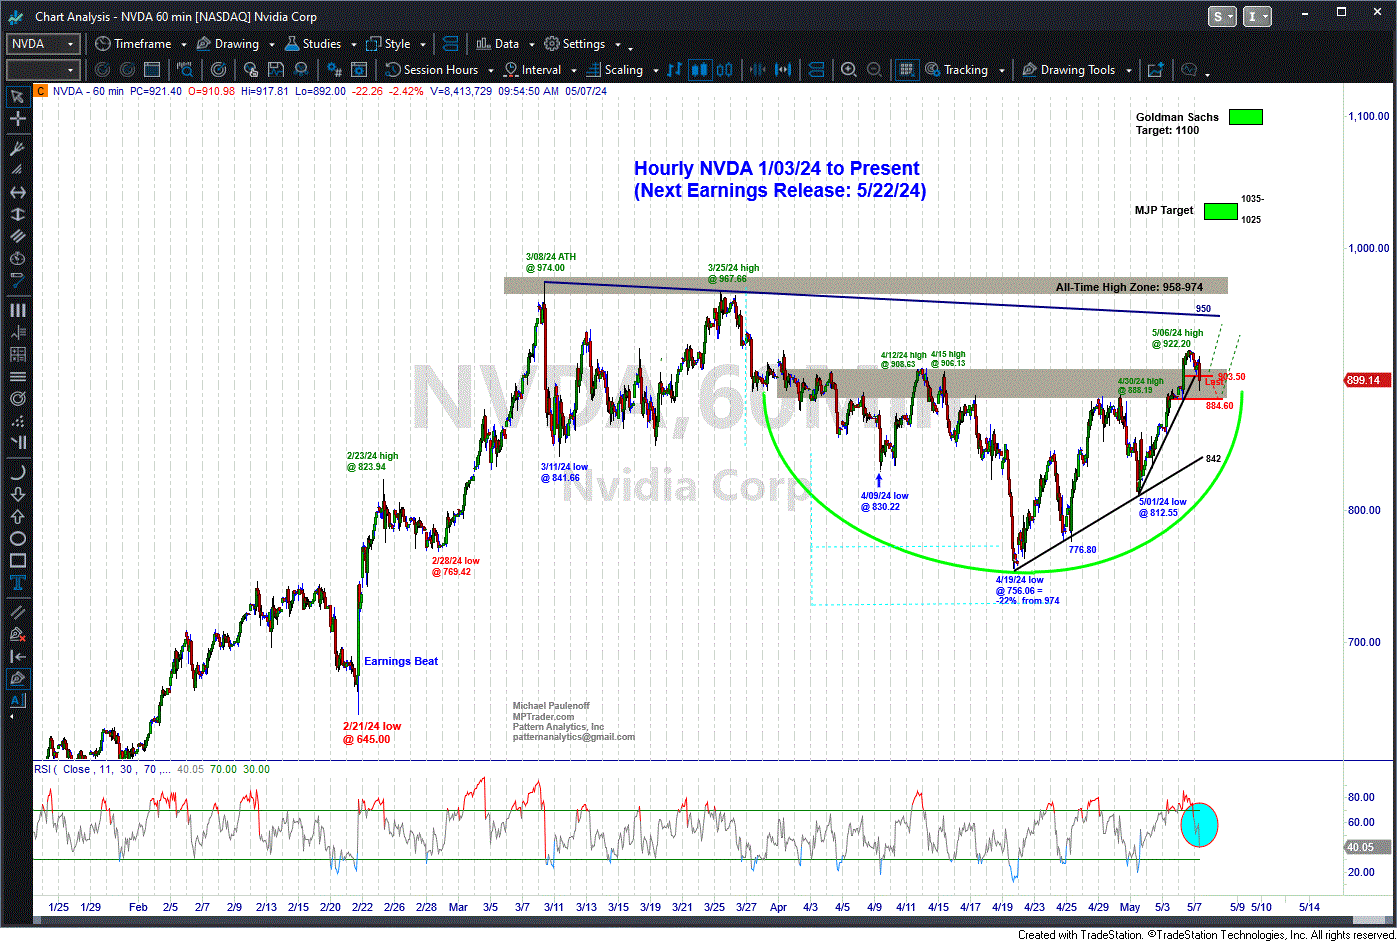
Hourly Chart on NVDA

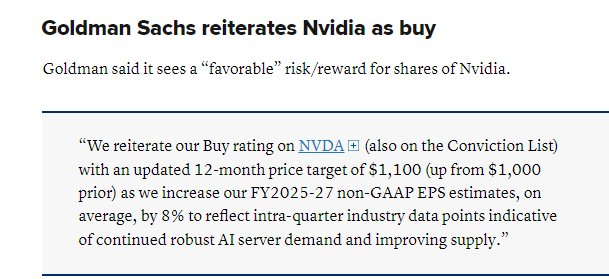
NVDA-- Goldman Sachs (see below) raised its target price to $1,100 from $1,000. 

My technical work (see attached chart) argues that as long as the 903.50 down to 884.00 nearest support zone contains forthcoming weakness, NVDA post-5/01/24 upleg from 812.55 remains intact, and as such, NVDA's near-term trajectory is higher into the 950-974 target zone to test the 3/08/24 ATH at 974.00... Last is 898.73 off of an intraday low at 902.31...

A pasted image


  Matched
x
  • Action-Oriented Trade Set-Ups in Stocks & ETFs
  • Macro Analysis of the Broader Markets
  • Detailed Technical Guidance for each Trading Idea
  • Live Interaction w/ Mike & Our Member Community
  • And Much, Much More!
Join Now! - Special Offer!
Veteran Wall Street analyst and financial author, Mike provides detailed and timely analysis and trade set-ups on a range of markets. Read more...

Have Mike's “Out Front” morning analysis delivered FREE to your email inbox twice weekly!