How ES, TLT & DXY Charts May React To CPI Data
Good Tuesday Morning, MPTraders! March 12, 2024-- Pre-Market Update: Today is CPI Tuesday! Like it or not, the algos and the markets will react to whatever the Government tells us is the "official" inflation rate for February. Here is what Mohamed A. El-Erian has to say about today's data:
It's CPI Inflation Day in the US, where much of the consensus is seeking confirmation that January's hotter-than-expected print was a seasonality-related fluke. The consensus forecasts are for annual core inflation to fall from January's 3.9% to 3.7%, and for headline to remain unchanged at 3.1%. On a month-on-month basis, the consensus forecasts are for 0.4% and 0.3% inflation, respectively.
What do my macro chart setups in ES, TLT, and DXY tell us about the likely directional reaction to the data?
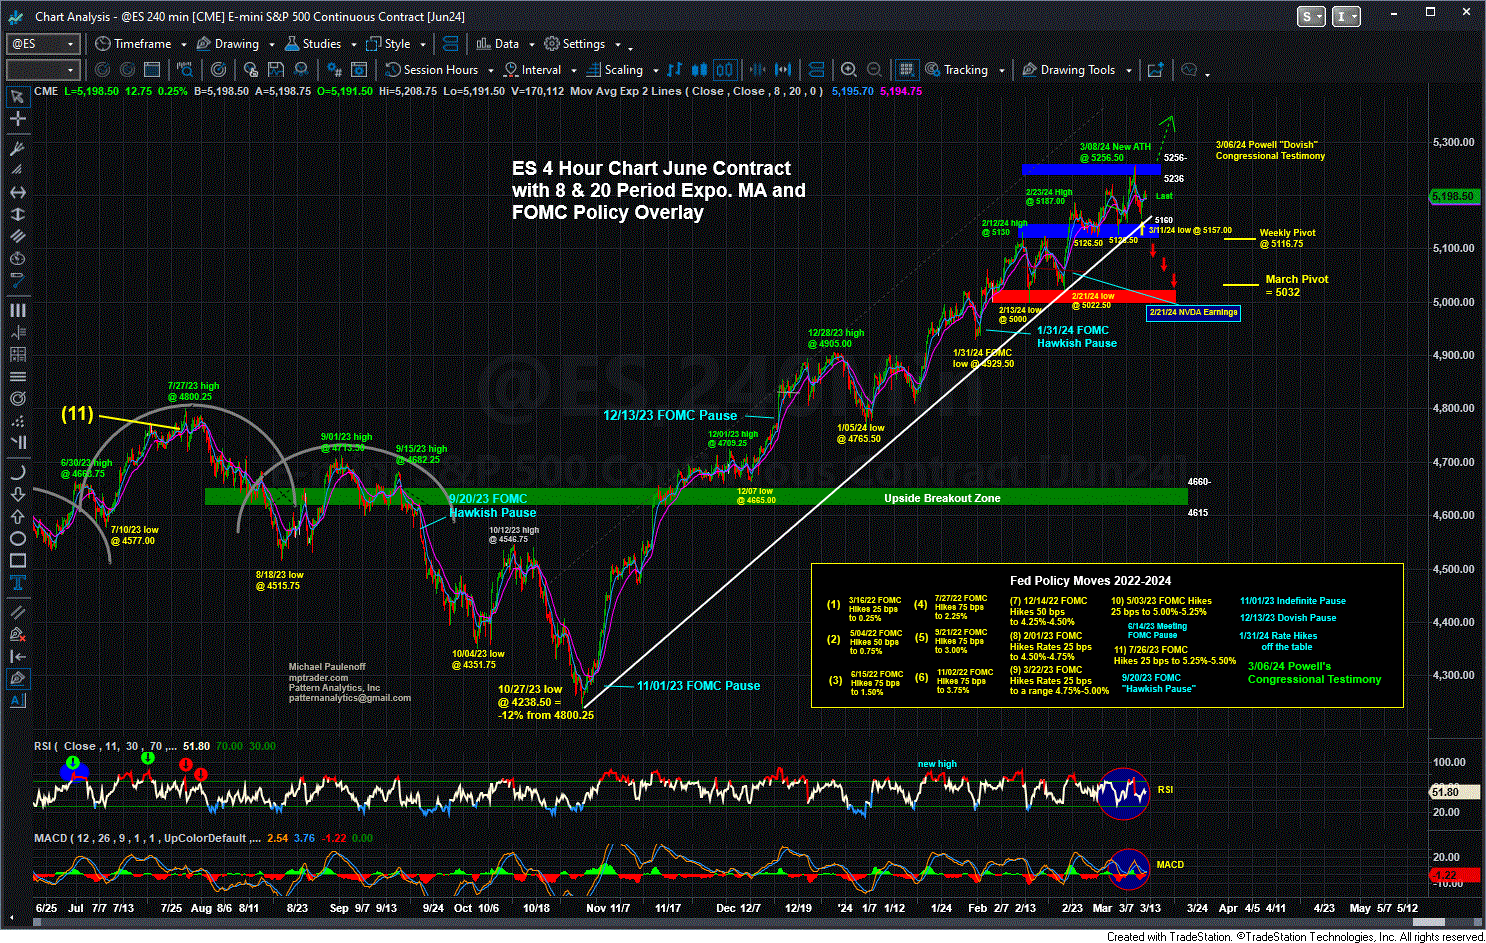
ES-- As long as any negative reaction to CPI is contained above key near-term support from 5125 to 5160, the dominant uptrend will remain intact, and as such, the path of lesser resistance is to the upside. A positive reaction that takes out nearest resistance between 5236 and 5256 will trigger upside continuation to new ATHs projected into the 5320-5350 target zone... Last is 5197.00... (Continued below the ES Chart)...
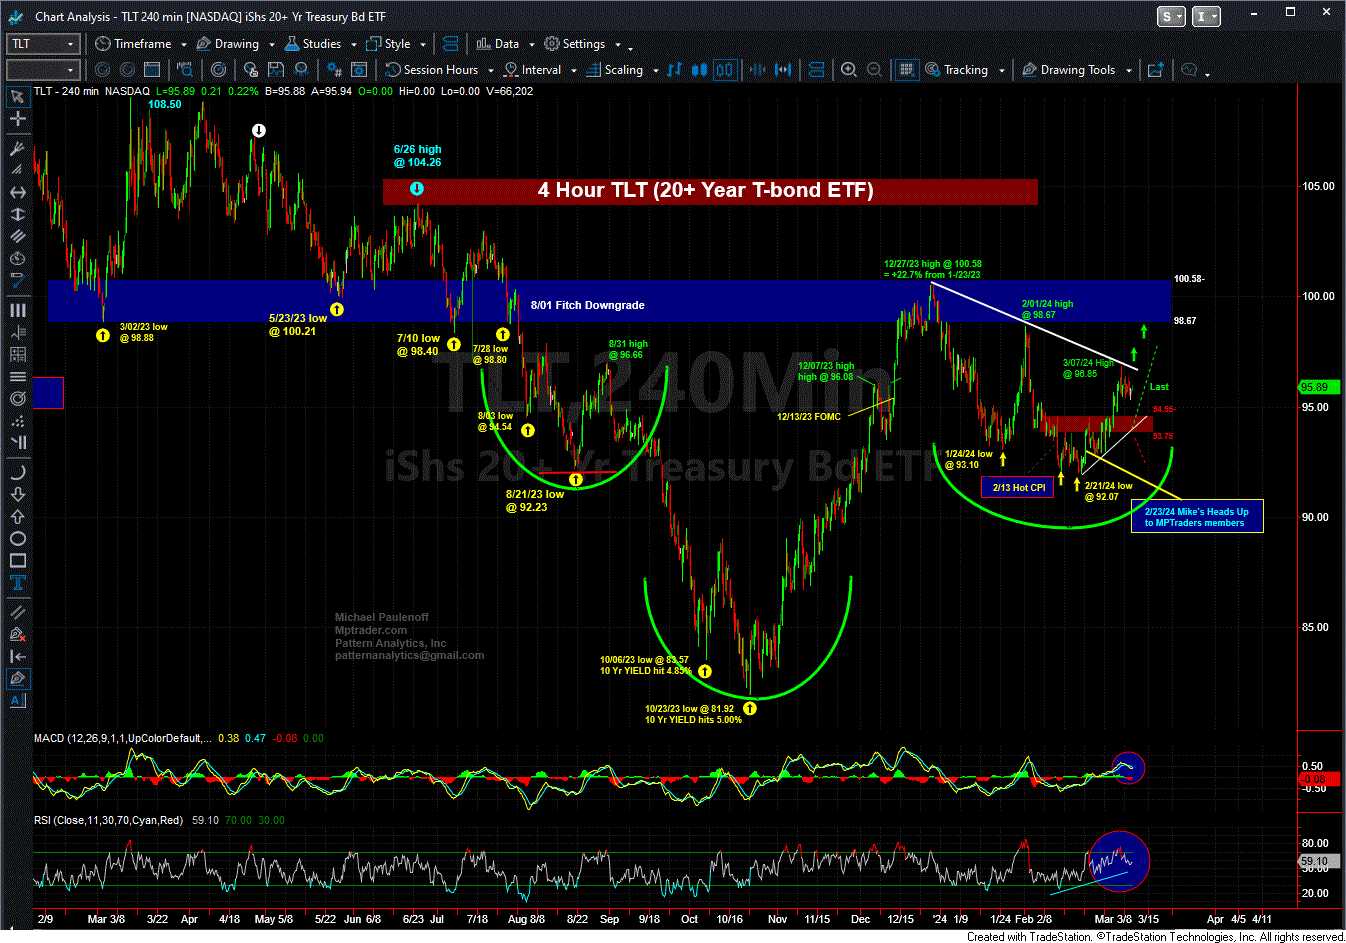
With respect to the bond market, the TLT (20+year T-bond ETF) exhibits a bullish near and intermediate-term technical setup off of its 10/23/23 low at 81.92. As long as any negative reaction to today's data is contained above 93.75 (see my attached chart), the dominant trend is up, and should TLT climb and sustain above last Thurs (3/07) high at 96.85, TLT will be poised for upside continuation to challenge consequential year-long resistance lodged from 98.67 to 100.58... Last is 95.97... (continued below my TLT chart)...
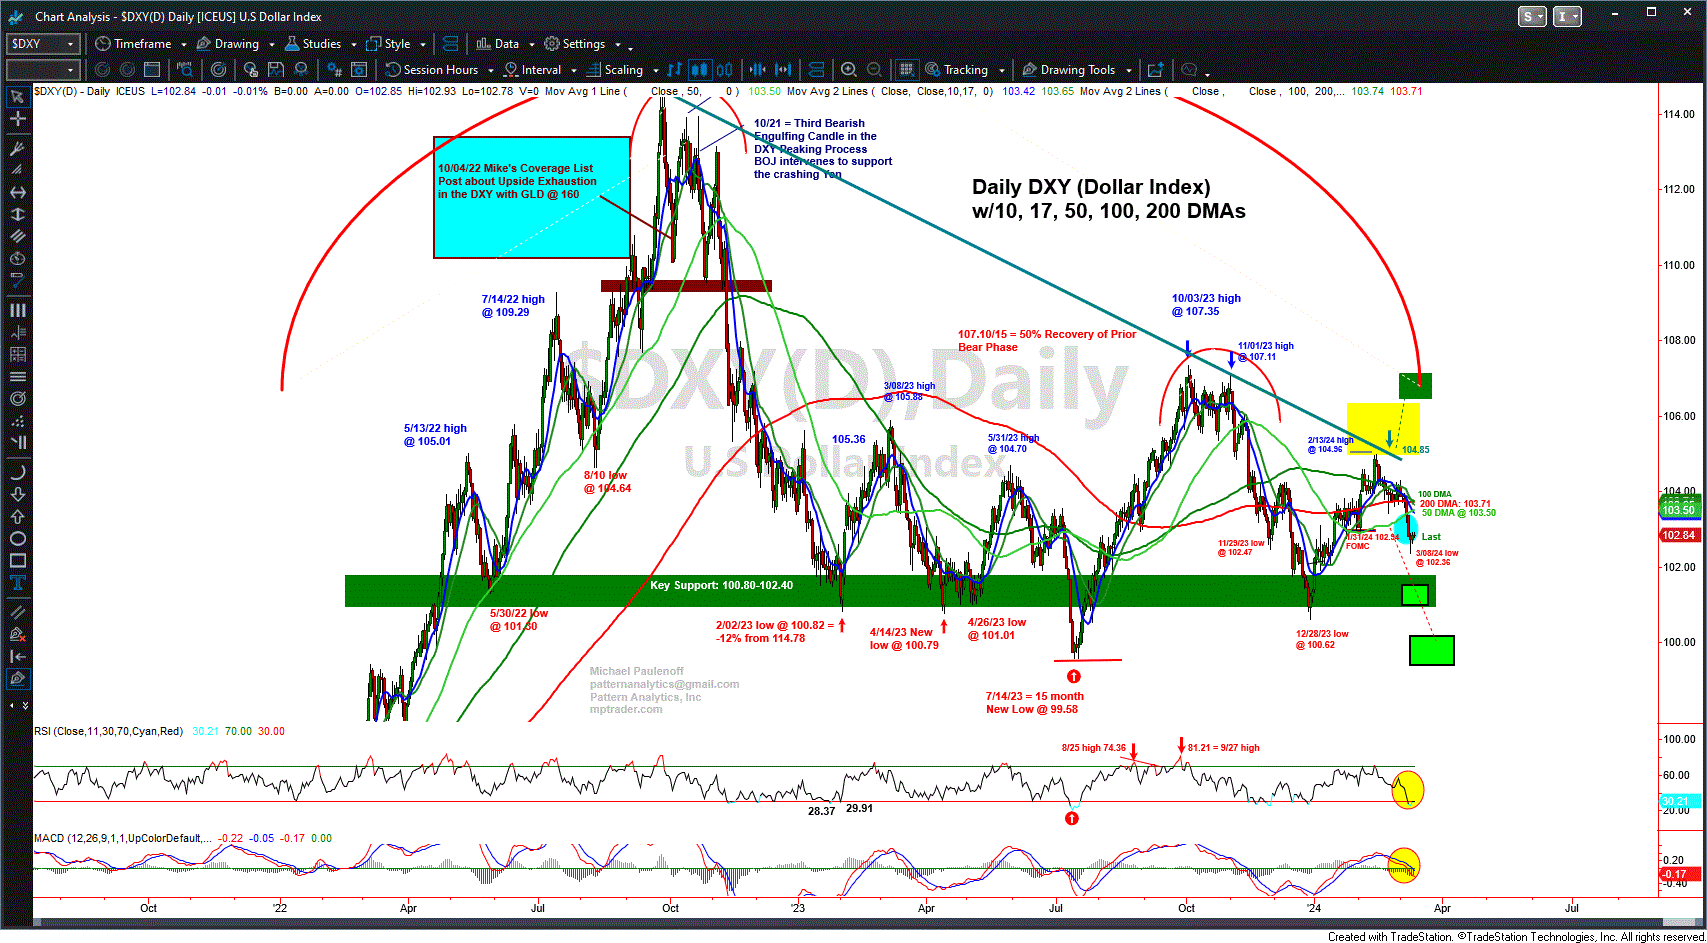
Finally, there is the US Dollar (Dollar Index), which we see on my Big Picture Daily Chart has been in the grasp of selling pressure since the middle of February. During the past 4 weeks, DXY has declined 2.5% as the Index presses closer to a very consequential challenge of its two-year support plateau from 98.60 to 100.62, which if taken out, will trigger a potentially significant downward spiral in the US Dollar. That said, however, for our purposes today, DXY is poised for downside continuation to 101.30/80 if CPI comes in cooler-than-expected. Only a sharp advance in reaction to adverse (hotter-than-expected) data that propels DXY up through key resistance from 103.50 to 103.80 will neutralize its currently vulnerable technical position... Last is 102.83...
More after the CPI data...


