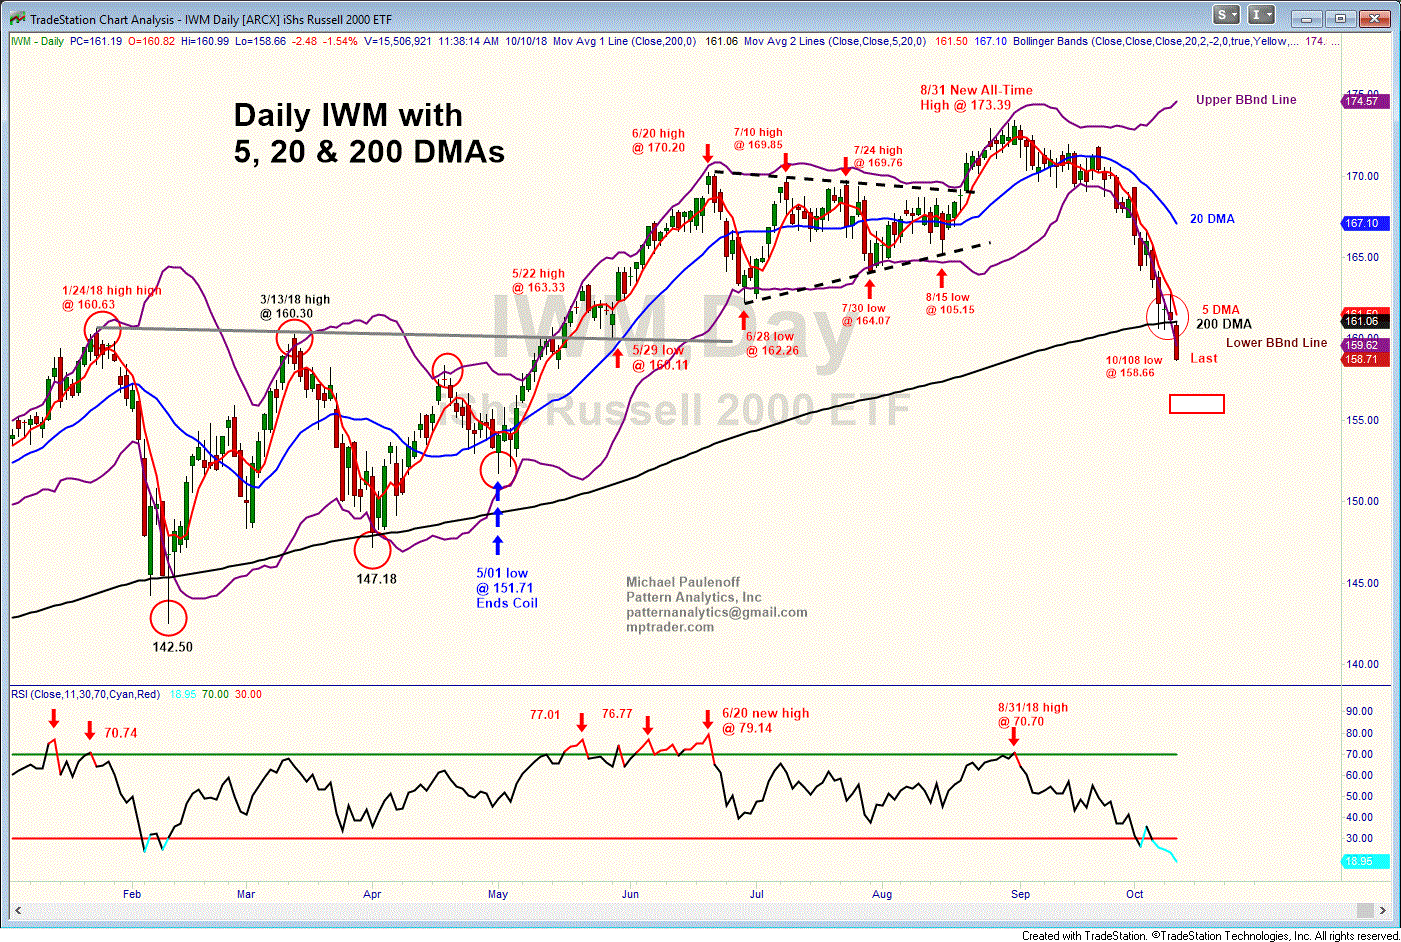
IWM Busts Beneath its 200 DMA
IWM-- following our bearish technical Script. This is what we discussed after the close last evening:
... the attached IWM chart, which we have been watching closely for the past two weeks. IWM has led all the major market index ETFs on the downside, and has plunged 7.5% from a new all-time high on 8/31/18 to yesterday's low. The decline has made a relatively rapid B-line right to the 200 DMA, which has managed to contain the weakness for the past three sessions.
Although the 200 DMA has dammed the flood of capital out of IWM, the price structure has failed to pivot off of the MA with any measure of power that is needed to imbue buyers or prospective buyers with confidence that the worst is behind us.
After three sessions, my sense is that IWM is running out of time to ricochet to the upside above the sharply declining 5 DMA (162.98). If such a ricochet does not emerge in the next day or so, the dam will be in jeopardy of breaking, and IWM flood waters will resume their cascade to the next dammed location, somewhere in the vicinity of 152.50, creating the potential for a 12% correction off of the high, which surely will get the attention of the other major market index ETFs.
Today's weakness has blasted beneath the 200 DMA, and has sent the IWM price structure towards my next target zone of 152-155... Last is 158.96/97

