
IWM Takes Off - Market Analysis for Nov 16th, 2017
 By
Mike Paulenoff
By
Mike Paulenoff
I am back from the doc...
IWM certainly has exploded into a vicious upmove that amounts to a 1.7% thrust compared with a SPY upmove today of 0.8%, and certainly looks like it ended its 5 week correction now that the price structure has blasted above the 5 DMA, now at 148.63. A close above the 20 DMA, now at 148.05 will be further evidence of a significant upside reversal into a new upleg.
The near term chart of the iWM/SPY Ratio shows that IWM has launched into a "recovery rally" after a significant downleg. That said, the chart continues to argue that IWM remains challenged in relation to its BIG CAP brethren, and continues to bear watching as the two indices appear to have entered a new upleg within their larger, dominant bull trends.
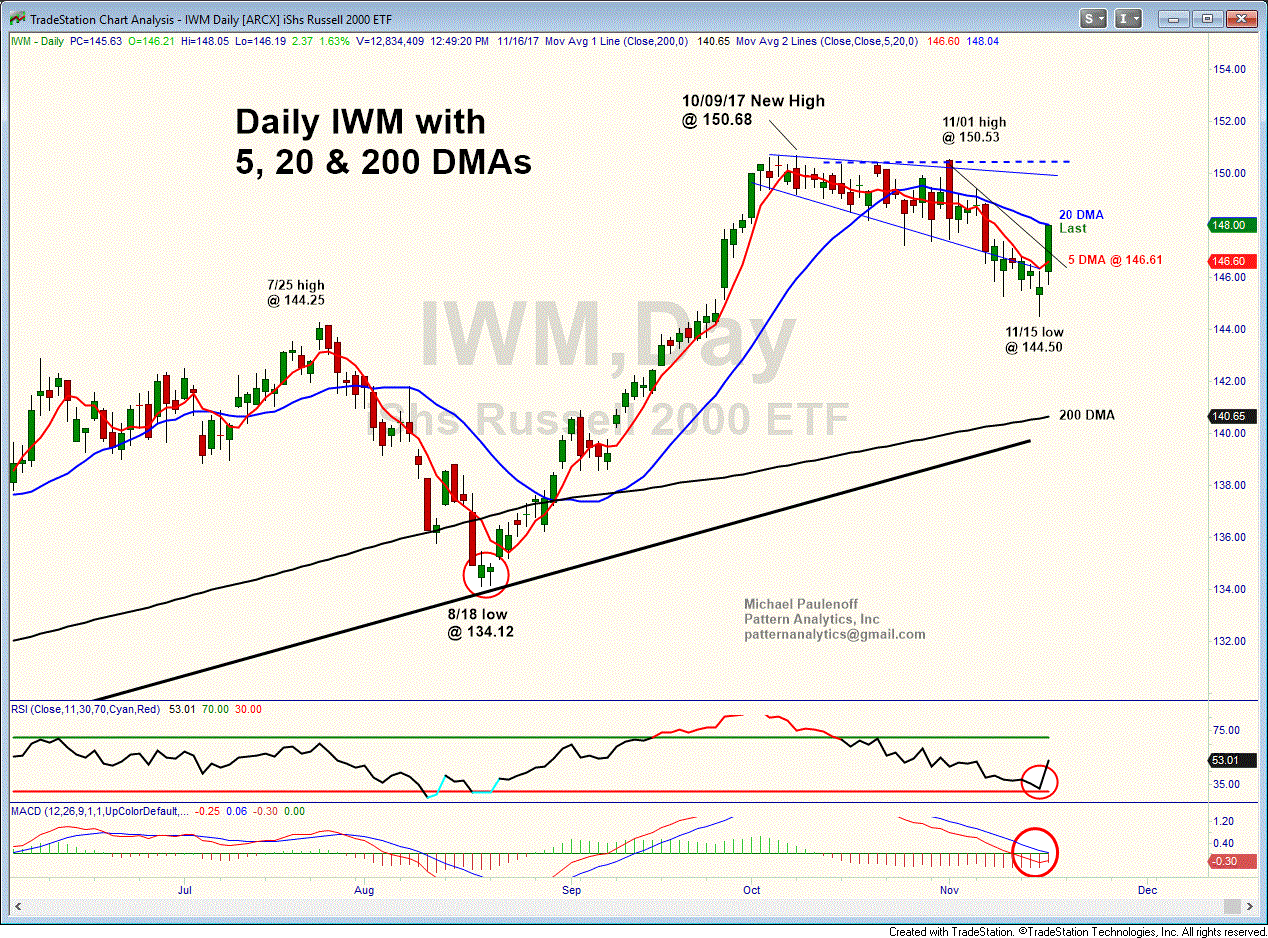
11 16 17 IWM Day 1250 GIF
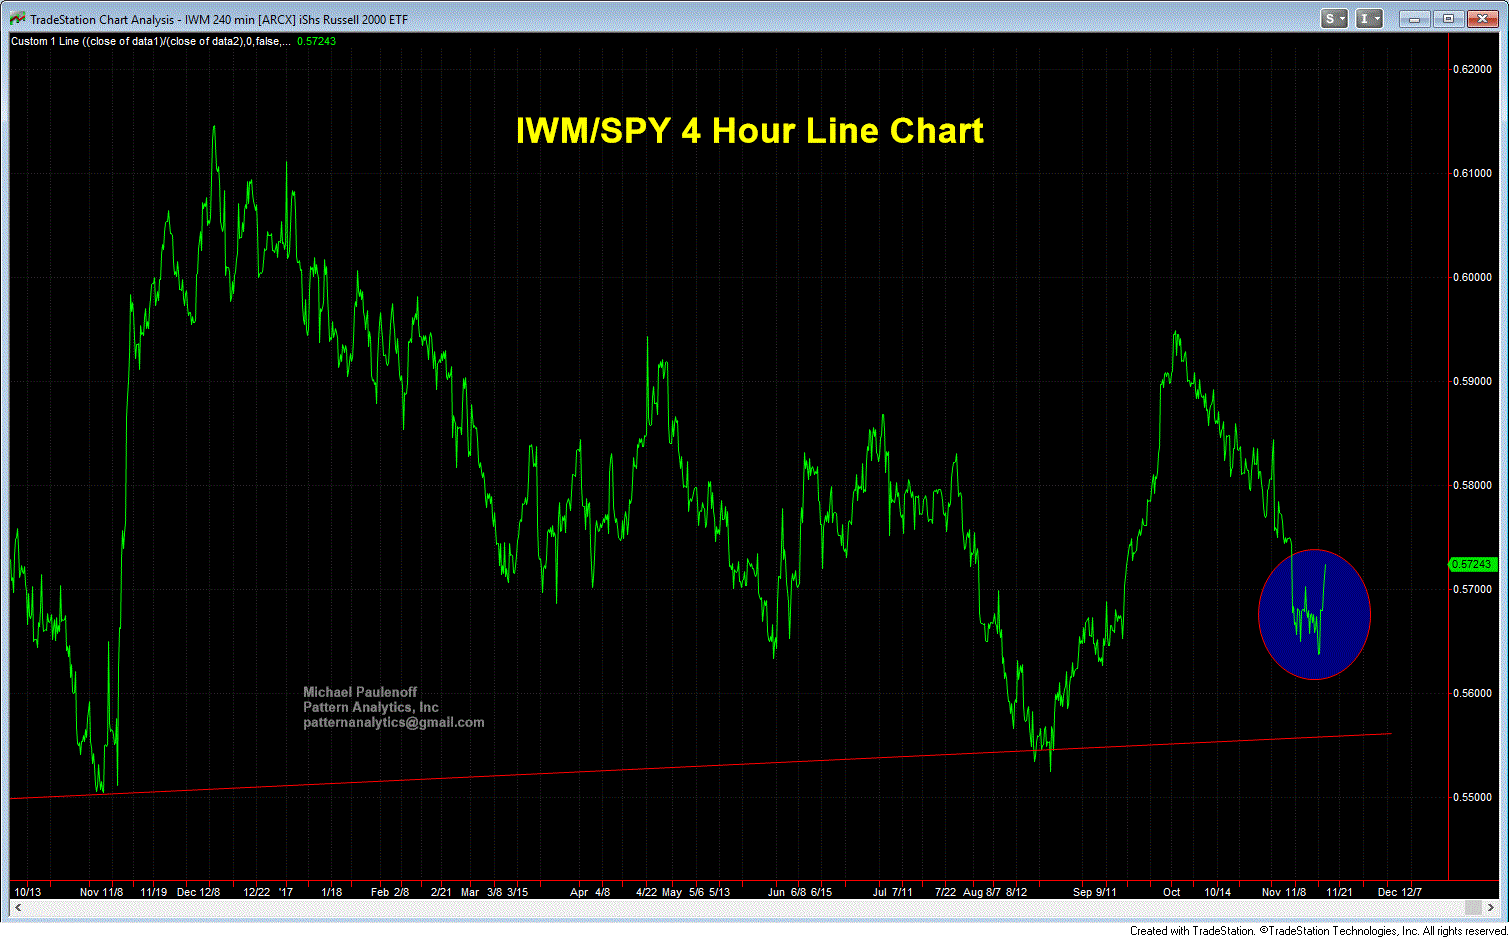
11 16 17 IWM SPY Ratio 4 hr GIF