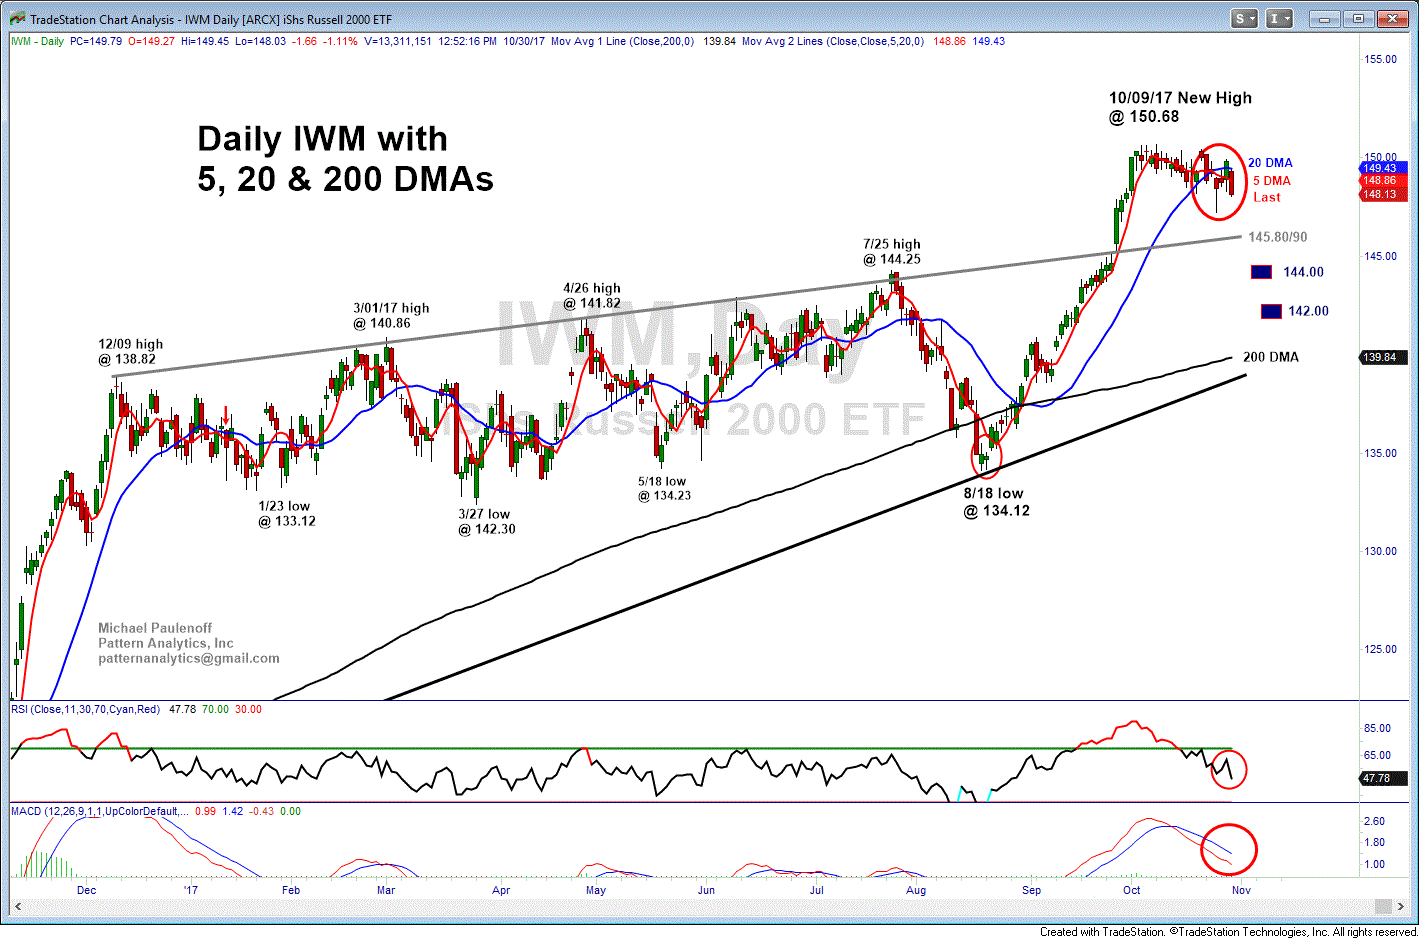
IWM in Topping Formation?
IWM certainly exhibits a different look and feel than SPY and QQQ. Let's notice on the enclosed daily chart that the Russell 2000 Small Cap ETF peaked back on 10/09 at 150.56, but since then, has managed to fail at multiple attempts to thrust to test the all time high. Instead, all of the action during the past three weeks is starting to look like a meaningful distribution top formation that is rolling over towards a test of key support at 145.80/90, which if violated on a closing basis, will point to 144 and then to 142.
Only a climb and close above the 20 DMA, now at 149.43 will neutralize the developing toppy pattern.
Our Model Portfolio is long the inverse 3 X bearsh IWM ETF-- TZA, at 13.28 from 10./04/17... last is 13.61/62

