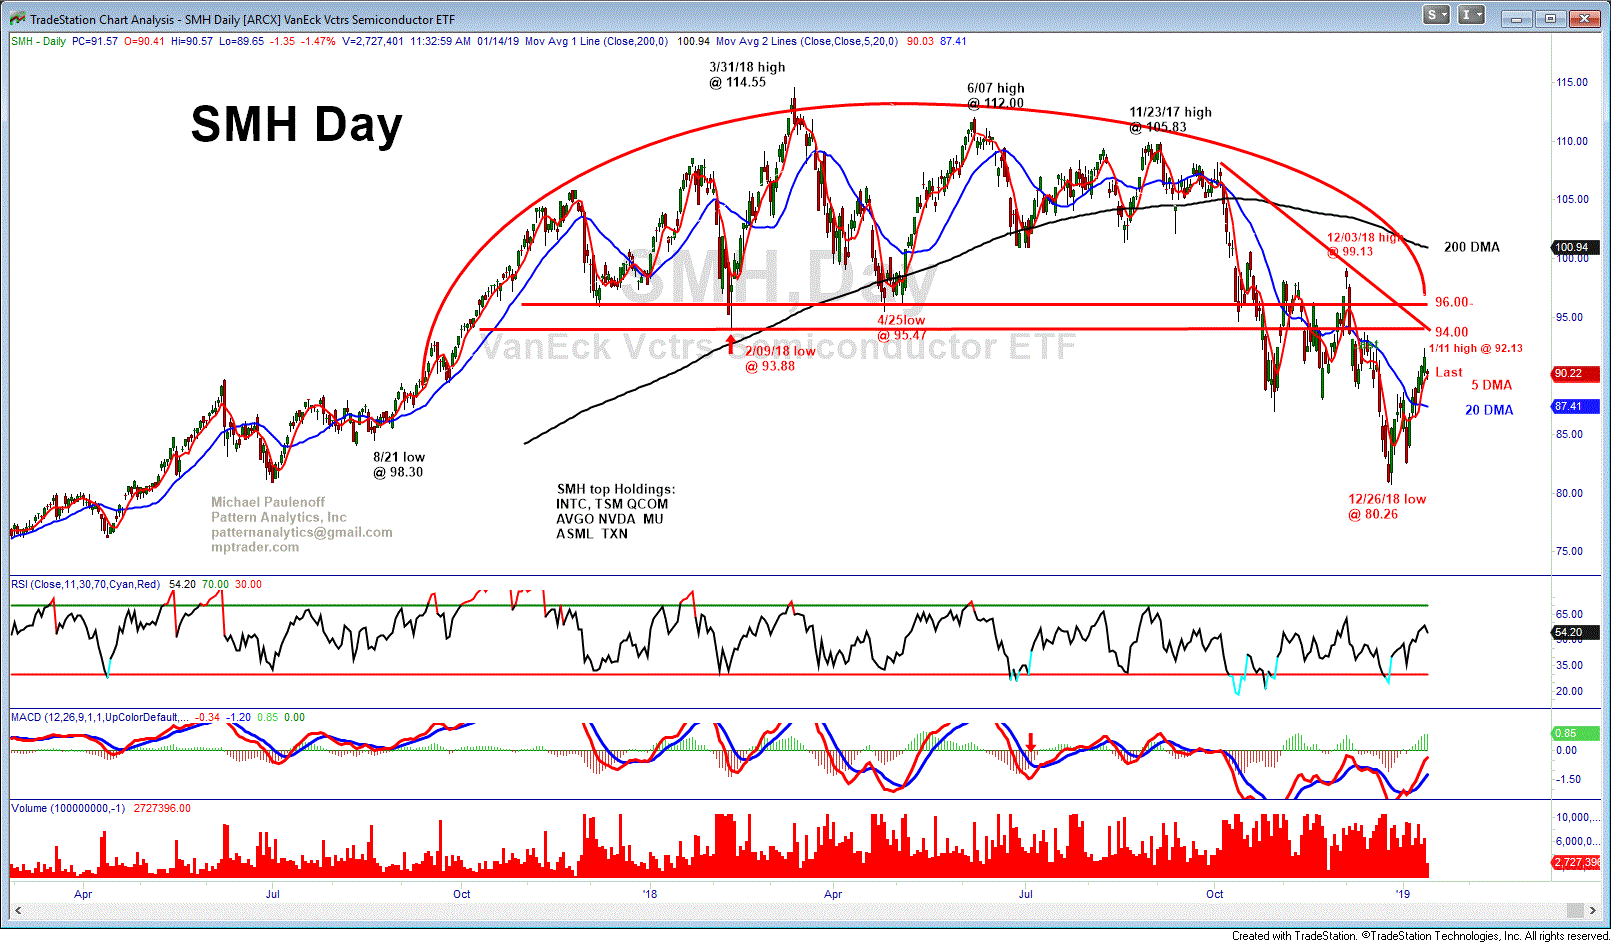
If the Big Picture Chart of SMH is Viewed Upside Down, it Would Present as a Screaming Buy, Which Means the Inverse is Also True
SMH (Semiconductor ETF)-- The most salient feature of the attached intermediate term chart is the massive 15 month top formation that broke to the downside in December, but which remains incomplete on the downside. All of the action off of the 12/26 low at 80.26 into last Fri.'s high at 92.13 has the right look of a counter-trend reaction that is nearing a retest of the breakdown zone from 94.00 to 96.00, if SMH gets there, prior to a resumption of weakness that revisits and breaks 80 towards my next lower optimal target of 77 to 74. Last is 90.46/47

