Is SFIX Finally Positioned for a Recovery Rally?
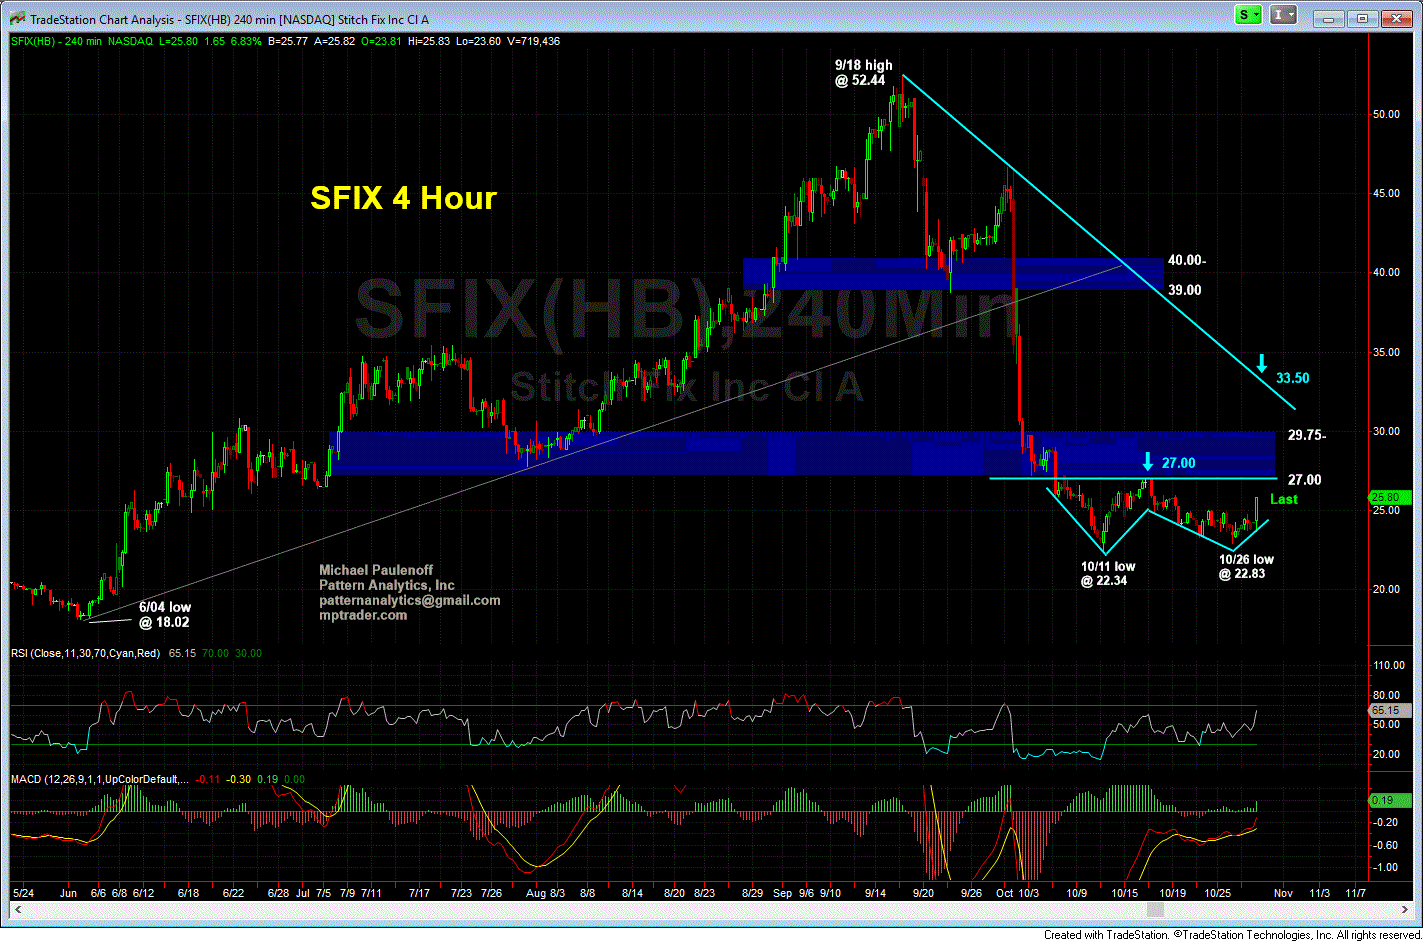
SFIX-- after an entire month of basing, SFIX exhibits a potentially promising near term technical set up. Let's notice that during Oct., SFIX out in a double low at 22.34 and 22.83, which could become a Double Bottom if the stock can rally and close above 27.00, which will lock-in the near term bottom, and will trigger $3 to $5 upside swing potential-- right into the vicinity of the dominant resistance line off of the 9/18/18 all-time high at 52.44 that cuts across the price axis currently at 33.50.
That said, however, in the absence of a close above 27.00, the October price action will suggest that SFIX has more work to do between 22.75 and 27.00.
SFIX is one to keep an eye on, but right at the moment, I would rather opt for near term bullish confirmation than anticipate continued upside. The pattern has incurred so much technical damage that prudence suggests confirmation over anticipation... Last is 25.80/81

