It's CPI Time Again!
 By
Mike Paulenoff
By
Mike Paulenoff
Good Wednesday Morning, MPTraders! September 13, 2033-- Pre-Market Update: It's CPI time again! At 8:30 AM ET will find out what the "official" inflation data look like as of the end of August, which algos, traders, and investors will immediately react to because the implications either will or will not support the end of the Fed's 18-month, 550 basis point rate hike cycle.
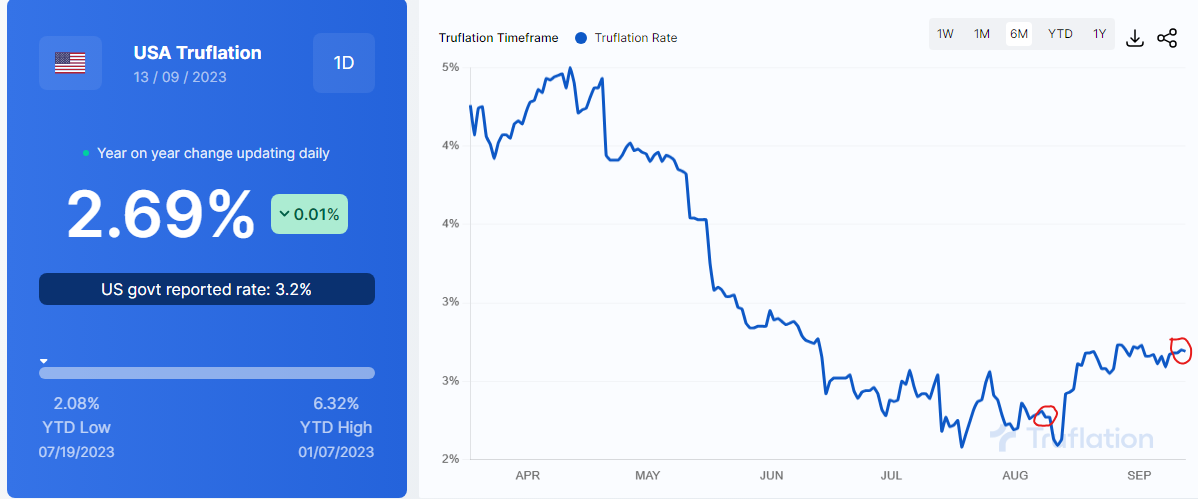
The Street is expecting Headline CPI for August to come in at 3.6% year-o-year compared with July's 3.2%. Annualized CORE Inflation is expected to decline to 4.3% from 4.7%. The 0.4% uptick in Headline CPI is exactly the same uptick recorded by the Truflation data (see graphic below), which recorded a 2.27% rate on August 10, 2023-- the date of the July CPI released. Today, although Truflation is running a touch hotter at 2.69%, let's remind ourselves that exactly 1 year ago Truflation data was running at 9.9%. In other words, unless today's Headline and CORE inflation data are much hotter than expected, the markets are unlikely to react violently in one direction or the other, and if that IS the case, then after the release, the technical condition of the markets will become the dominant influence on price direction.
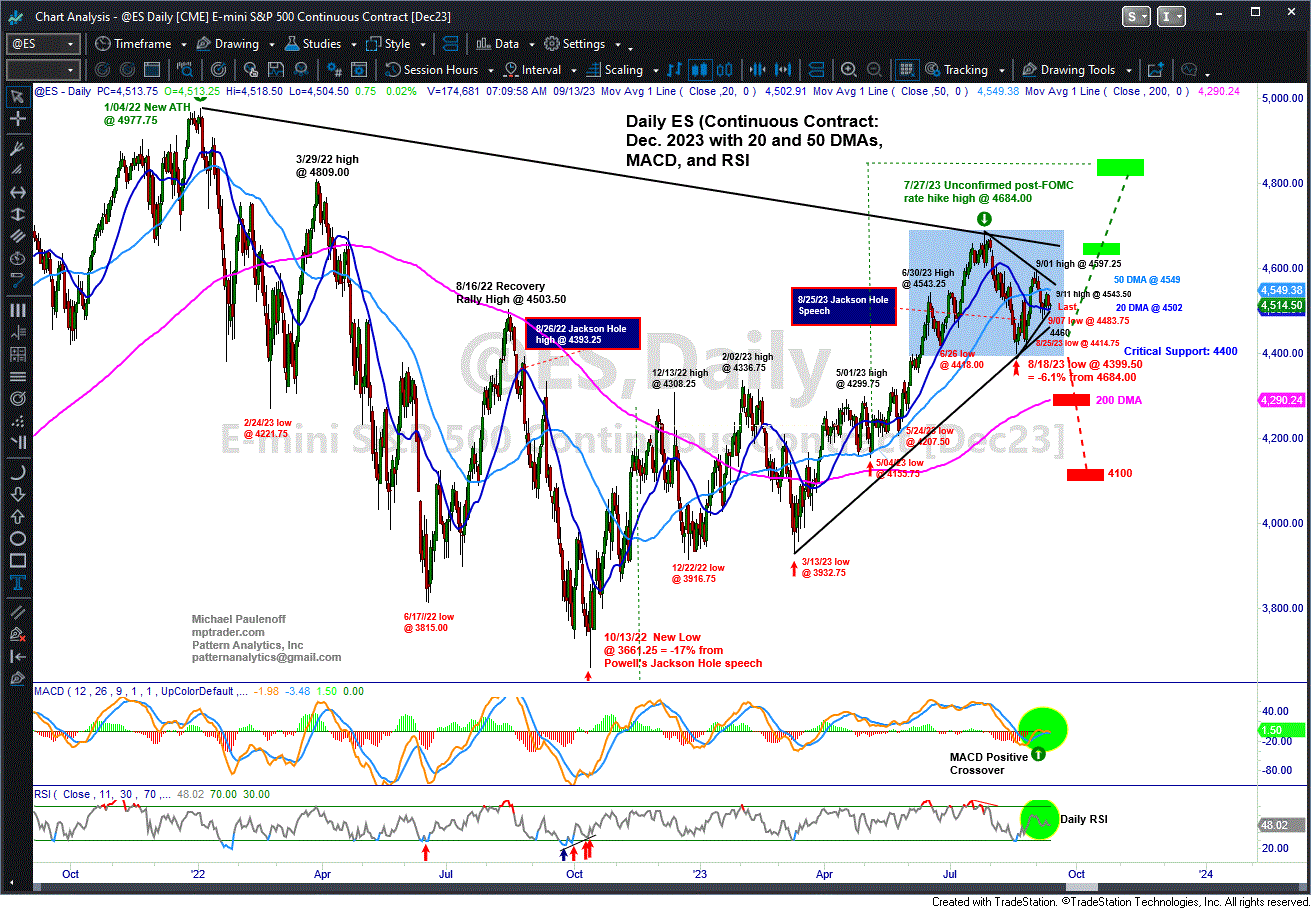
On the subject of the technical setup of ES, let's head into the 8:30 AM ET report with a view of my Big Picture Daily Chart (below the Truflation graphic). What jumps out at me is that all of the price action since early June 2023-to-present (demarcated in light blue on my chart) represents EITHER a developing Top Formation ahead of a potentially significant downside extension of the correction off of the 7/27/23 high at 4684 (see thick Red dashed Line), OR a rangebound digestion period that will resolve itself to the upside (see thick Green dashed line).
The cut-off or key support plateau that will determine the resolution of the big picture pattern resides at 4400 to 4420. As long as 4400-4420 contains any forthcoming acute weakness, my preferred scenario argues that the post-June period represents a bullish digestion pattern that when complete, will resolve itself to the upside in a potentially powerful new upleg that retest the July 2023 high-zone at 4630/80, and possibly makes a run at 4800-4840.
From a more granular perspective-- in reaction to the CPI Report, key intraday support resides from 4480 down to 4460, which must contain any adverse knee-jerk reaction to the economic news. Conversely, on the upside, key intraday resistance hovers from 4543 to 4573... Last is 4515.00... More after the data...