Key Levels to Watch In NVDA
 By
Mike Paulenoff
By
Mike Paulenoff
NVDA Update: Of course, if the QQQ rolls over and breaks key support at 495.50 to trigger a preliminary downside reversal signal we discussed in my prior post (scroll down), NVDA probably will have to be on the defensive as well.
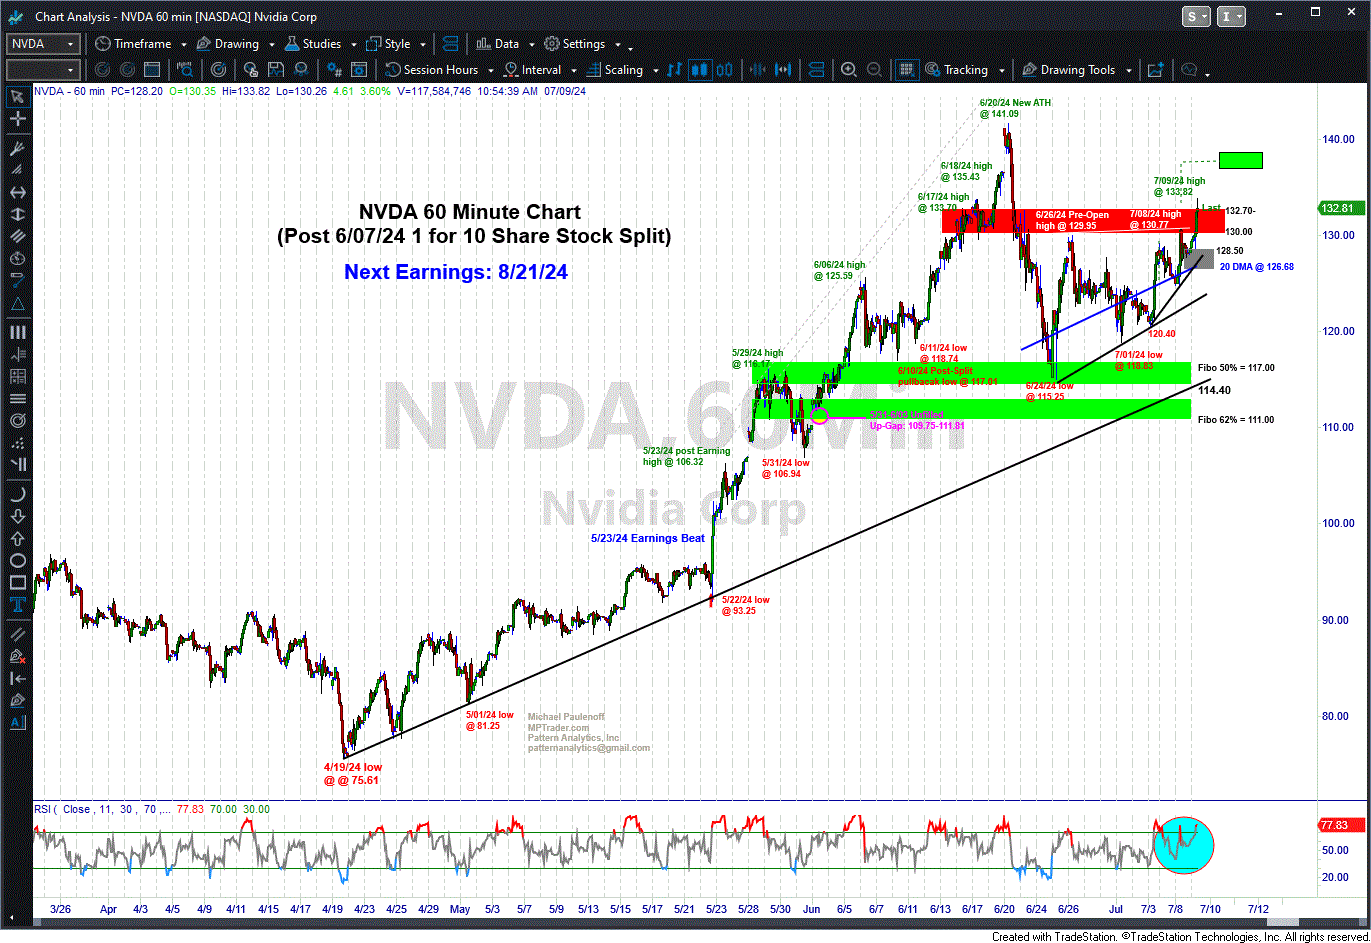
My attached Hourly Chart of NVDA shows that the stock has climbed above key resistance at 130.00-130.80 this AM, which has attracted follow-through buying that has propelled NVDA to a new 3-week high at 133.82. As long as any forthcoming weakness is contained above consequential support from 128.50 down through 126.70, NVDA's pattern setup will remain positive (bullish) and argue for upside continuation toward 137-139 next.
Conversely, a decline that breaks beneath the up-sloping 20-DMA, now at 126.68, will morph the upmove from the 6/24/24 low at 115.25 into an "intervening" rally to a lower-high that separates two distinctly separate corrective downlegs within a still-developing incomplete correction off of the 6/20/24 ATH at 141.09 that will project at least to a retest of the 115.25 low on 6/24/24... Last is 132.00...