LNG Peaking? - Market Analysis for May 21st, 2018
 By
Mike Paulenoff
By
Mike Paulenoff
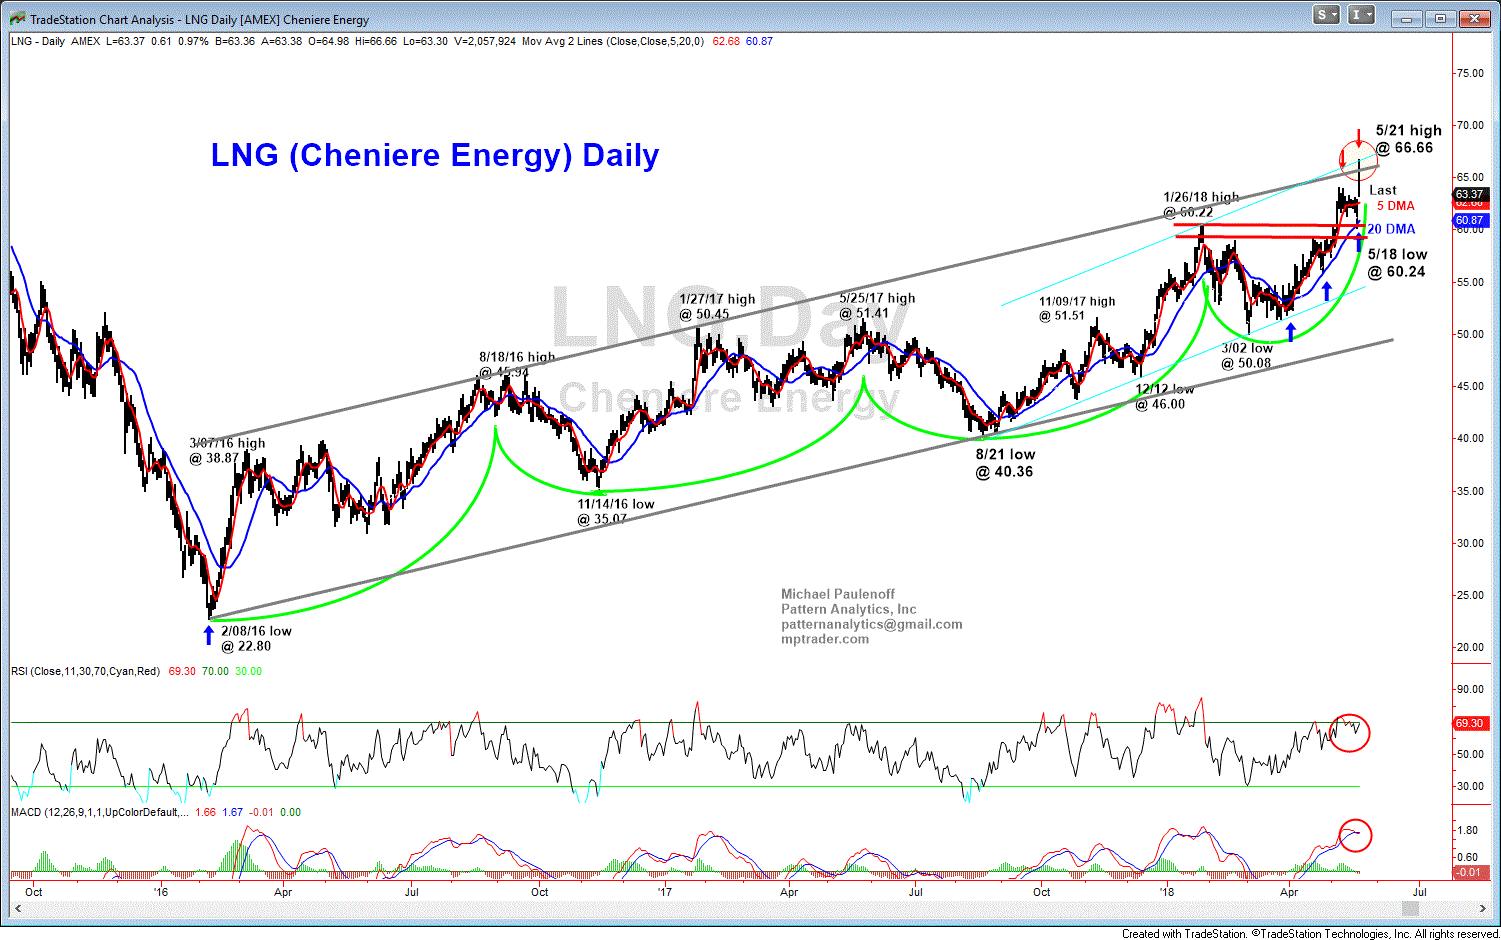
LNG-- It should not be a surprise that LNG hit its bear phase low at 22.80 in early Feb. 2016, right around the time of the low in NYMEX Crude Oil at $26.05. The attached daily chart shows the beautiful, well-defined bullish price channel that has developed during the past 2-1/4 years.
Today, LNG hit its highest price since Aug. 2015, but in so doing popped above the upper channel resistance line at 65.80, then ran to 66.66 (is four 6's better or worse than three 6's?), prior to reversing under the upper resistance line again. Right now, LNG is trading at 63.37, suggesting that there IS serious resistance along the upper channel boundary line.
Inability of LNG to climb to regain the upper channel could be problematic in the near term, and likely is warning LNG bulls that the most recent upleg from the 3/02/18 low at 50.08 to today's high at 66.66 is complete, which if accurate, means that LNG is peaking and starting a correction that will point the price structure towards a test of support in and around the 60.50-59.20 area prior to a resumption of strength.