Levels to Watch for FCX
 By
Mike Paulenoff
By
Mike Paulenoff
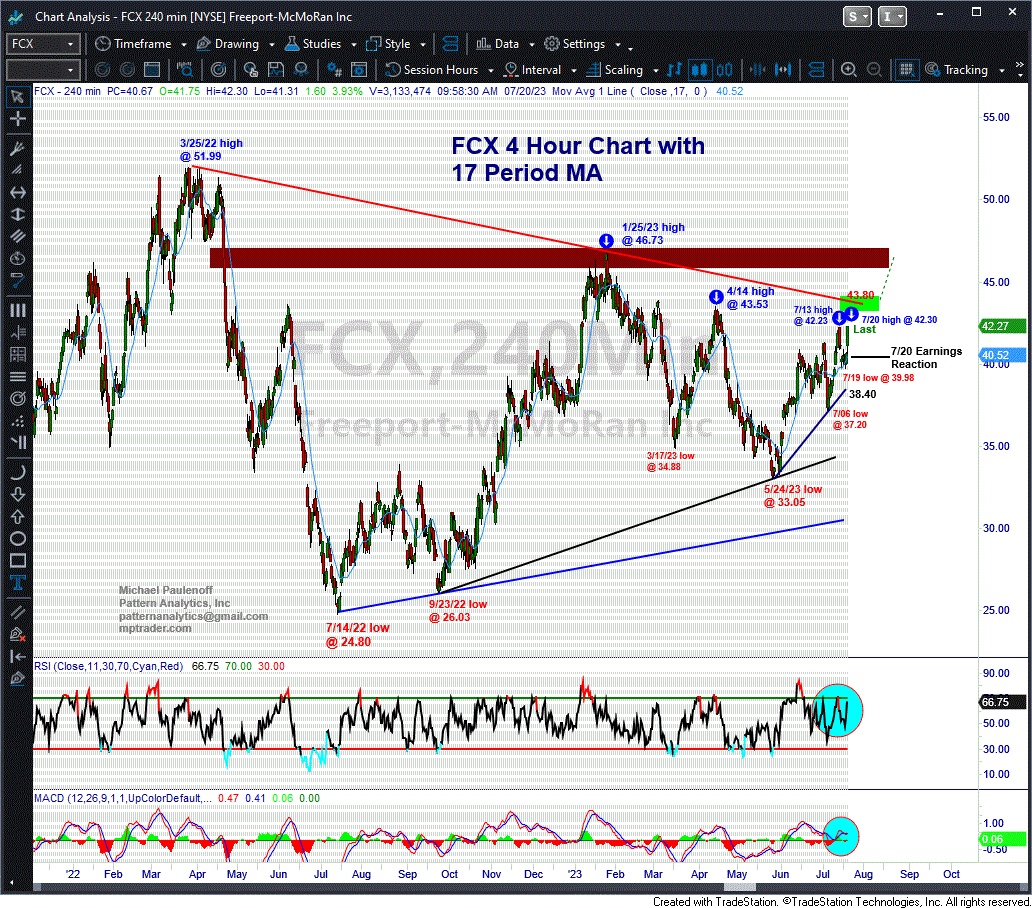
FCX (Freeport-McMoran) reported mixed earnings results this AM (see Seeking Alpha article below), but the stock opened over 2% higher in any case, owing largely to non-earnings factors (China stimulus).
That said, however, my attached 4-Hour Chart shows that this AM's strength still has not propelled FCX up and through key resistance that hovers at 1) the April rally high at 43.53... and 3) along the 15-month resistance line now in the vicinity of 43.80. If and when FCX takes out resistance between 43.50 and 43.80, it will trigger a powerful upside projection to 46-47 in route to 51-53.
In the absence of such an upmove above 43.80, FCX will continue to be wedged between its rising nearer-term up trendline now at 38.40 and the series of resistance points listed above (and demarcated on my attached chart). Last is 41.85...