My Pattern Bias Is To The Downside
 By
Mike Paulenoff
By
Mike Paulenoff
Good Tuesday Morning, MPTraders! June 17, 2025-- Pre-Market Update:
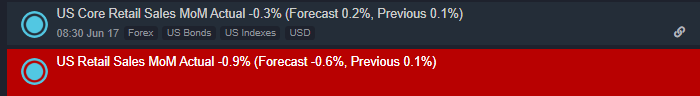
-- Retail Sales (8:30 AM ET)... Industrial Production and Capacity Utilization (10 AM ET)...
-- Day #6 of the Israel-Iran War... Will the U.S. threaten to enter the conflict to secure an Iranian surrender, probably the most politically and geopolitically desirable scenario for POTUS? Or will the Iranians hold out to the bitter end to try to force the U.S. to enter the conflict, if only to use its B-2 bombers to destroy the Fordow nuclear site to arrive at a denuclearized Iran? What then?
-- Tomorrow is the next FOMC Meeting, Policy Decision, and Powell Press Conference...
The equity futures markets are lower this AM, but not dramatically so. The weakness is just enough to keep the potential downside fallout from the conclusion of the May-June Rising Wedge formation intact and viable for the hours directly ahead. My attached 30-Minute and Daily ES charts show my preferred scenario, which argues that a correction that commenced after the 6/11/25 high at 6127.00 is unwinding slowly (so far) to the downside, and has an optimal target support window in and around 5940/50 (-3% from 6127), but possibly to the 5825/50 target window (-5% from 6127). Only a sustained climb above 6109 will neutralize my currently "corrective" near-term outlook.. (continued below my 30-Minute Chart)...
From my Big Picture Daily Chart setup, my Yellow Support Box defines downside risk from an intermediate-term perspective. Only a bout of weakness that slices beneath key support from 6060 down through 5960 will inflict severe technical damage, which will pivot my work to bearish from corrective... (continued below my Daily chart)...

The view from my SPY setup indicates that unless and until SPY strength takes out resistance at 604.45, my pattern bias is to the downside that breaks last Friday's (6/13) low at 593.79 en route to an optimal target window in the vicinity of 583-584... (Continued below my SPY chart)...
Based on the cash SPX seasonal propensities for the past 25 years, the next several trading days have been weak historically, which adds a bit of negativity to the near-term outlook... Last in ES is 6058.50... Last in SPY is 599.65....
Next up: SLV and SIL on the move to the upside this AM...