My QQQ Point & Figure Chart is Ominous
 By
Mike Paulenoff
By
Mike Paulenoff
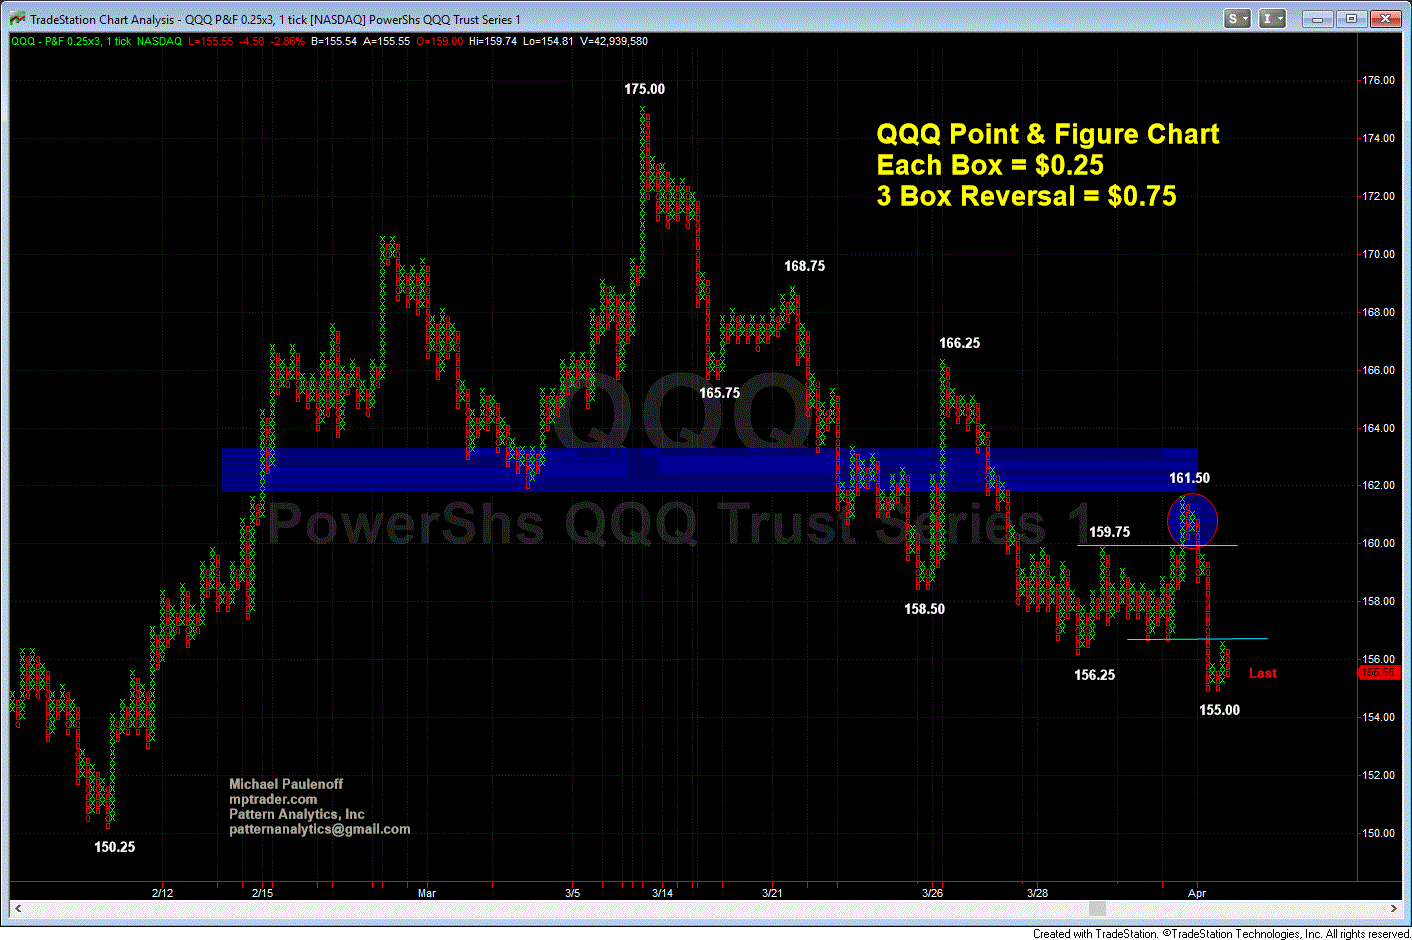
From the perspective of my QQQ Point & Figure chart, let's notice that off of its all-time high print of 175.00, QQQ has carved out a well-demarcated series of lower-lows and lower-highs.
Last Thursday's upmove created an up-column of Green X's that took out the prior rally peak at 159.75, and triggered a run to 161.50 prior to the roll-over into today's sharp down-column of Red O's.
The failure of last Thursday's advance to sustain above 159.75 suggests to me that a recovery rally after a completed downleg from 175.00 to 156.25 ended at 161.50 (on Thursday PM), and that all of the action off of the 161.50 high into today's low at 155.00 so far, is the initiation of a new downleg within the larger dominant downtrend (from 175.00).
If my work proves reasonably accurate, then QQQ in in the early stages of "unwinding" to test its Feb. low at 150.13, in route to a optimal corrective target of 144.60 to 142.50. Only a print of 159.00 will neutralize my current outlook. Last in QQQ is 155.32...