My SPY Unfilled Gaps Chart is Bending Like Beckham
 By
Mike Paulenoff
By
Mike Paulenoff
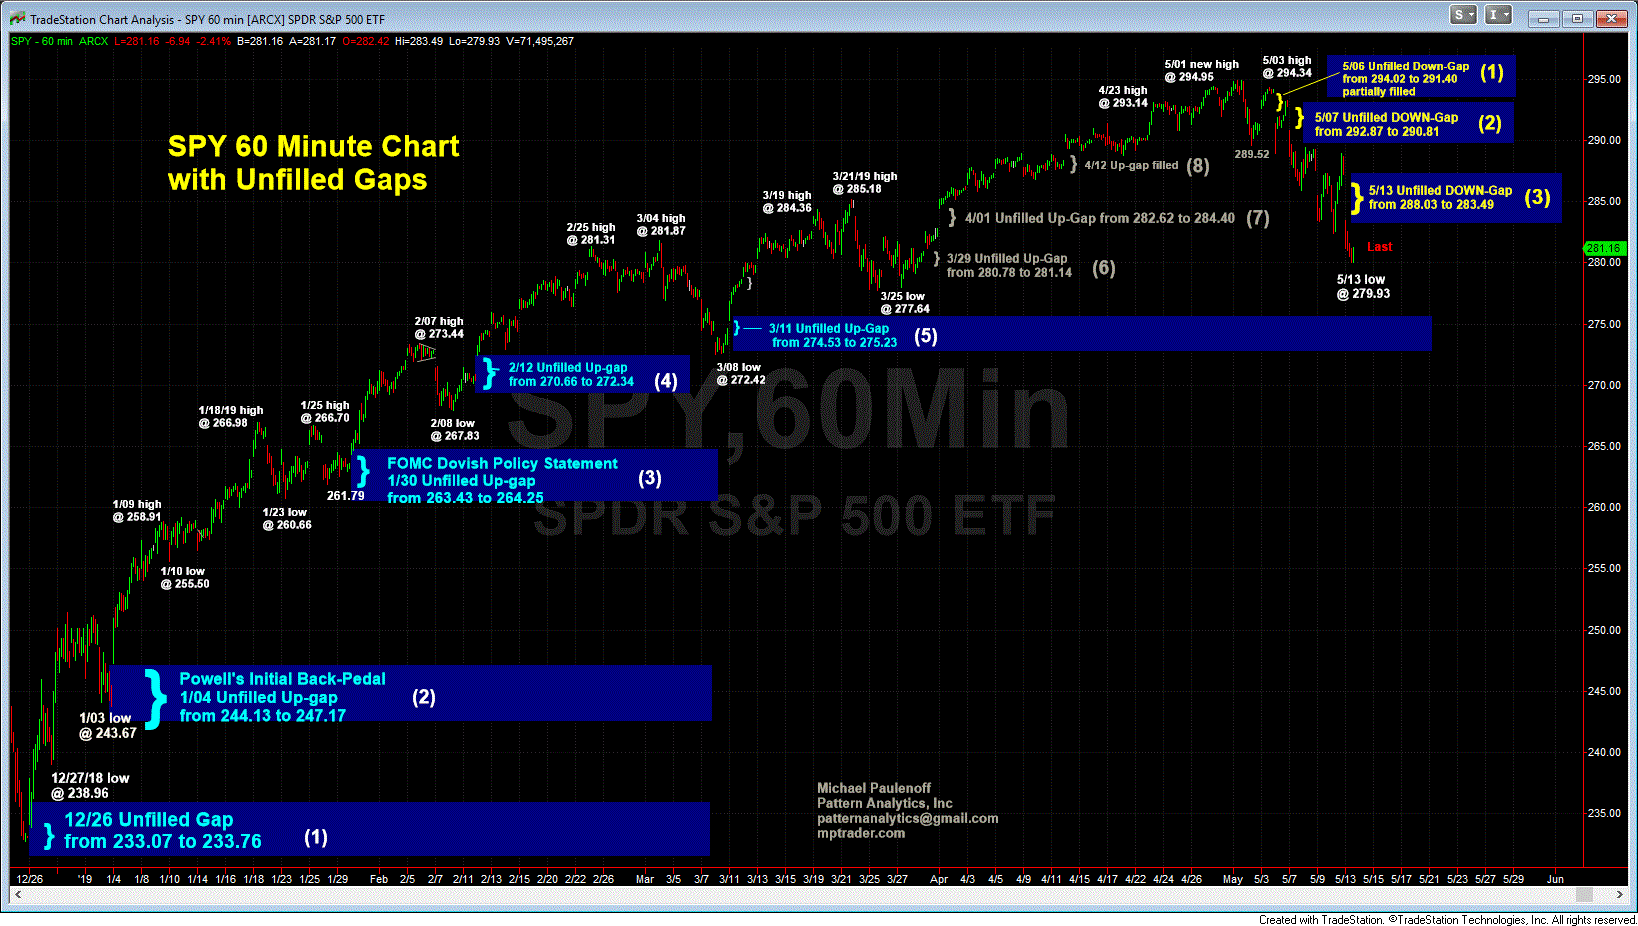
An updated view of my Unfilled Gaps SPY Chart, which shows that from the 12/26/18 SPY low at 233.07 to the 5/01/19 high at 294.95, SPY left behind 8 unfilled gaps.
Since SPY peaked on 5/01/19 at 294.95, the price structure has rolled over into a correction that hit a low earlier today at 279.93, or 5% off of the all-time high.
Along the way, the decline has has filled the three highest (most recent) unfilled up-gaps, but the weakness itself has created three new unfilled DOWN-GAPS. Today's sharply lower opening left behind a HUGE down-gap from 288.03 to 283.49. So far today, the SPY recovery rally has only been able to climb to 281.97, leaving a considerable distance still to travel before clawing its way into the lower portion of the unfilled down gap starting at 283.50.
Finally, let's keep in mind that there are 5 remaining unfilled up-gaps, the next lower being 275.23 down to 274.53 (from 3/11/19). The longer SPY takes to claw its way to fill this AM's down gap open, the more likely we will see the lower 3/11 gap filled, suggesting that SPY is vulnerable to another 2-1/2% decline in the hours immediately ahead... Last is 281.46/47