My Technical Work on XBI (SPDR Biotech ETF) is Starting to Emit Positive Potential Again
XBI-- two views of the SPDR Biotech ETF:
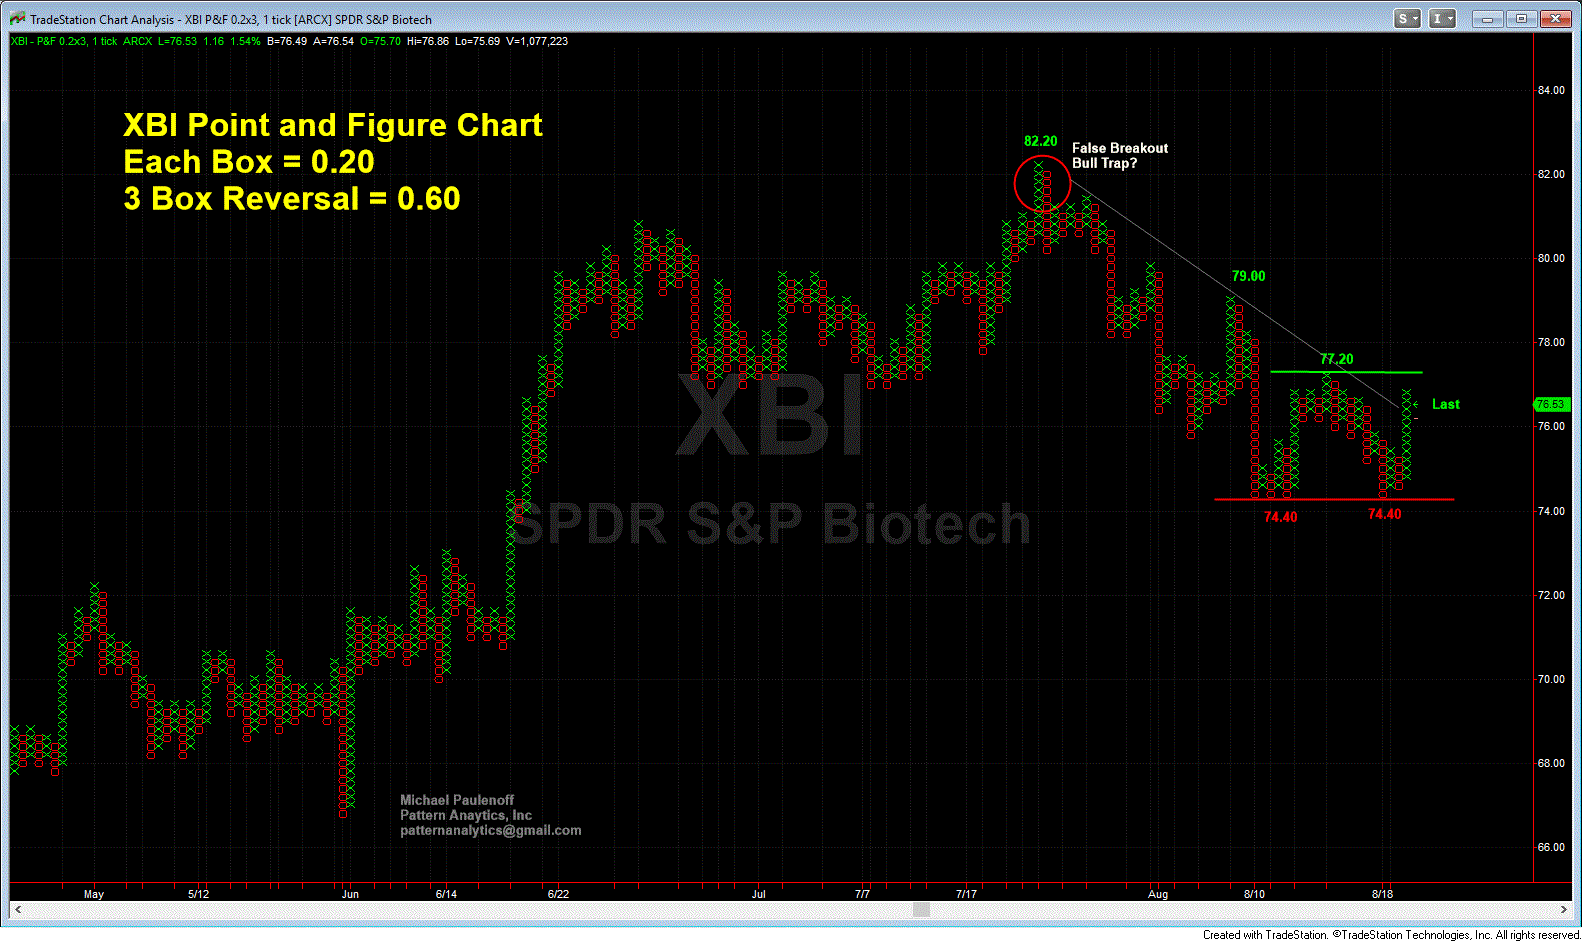
-- From an XBI Point & Figure perspective, let's notice that the correction off of the high print (and Bull Trap) at 82.20 (7/25) initiated a correction that recently has established potential Double Bottom lows and support at 74.40-- representing a pullback of 9.5%. The ensuing rally off of the Double Low has pierced above an important resistance line at 76.20, and is heading for a confrontation with the prior P&F rally peak at 77.20, which if hurdled on a print of 77.40, will trigger a new XBI near term buy signal.
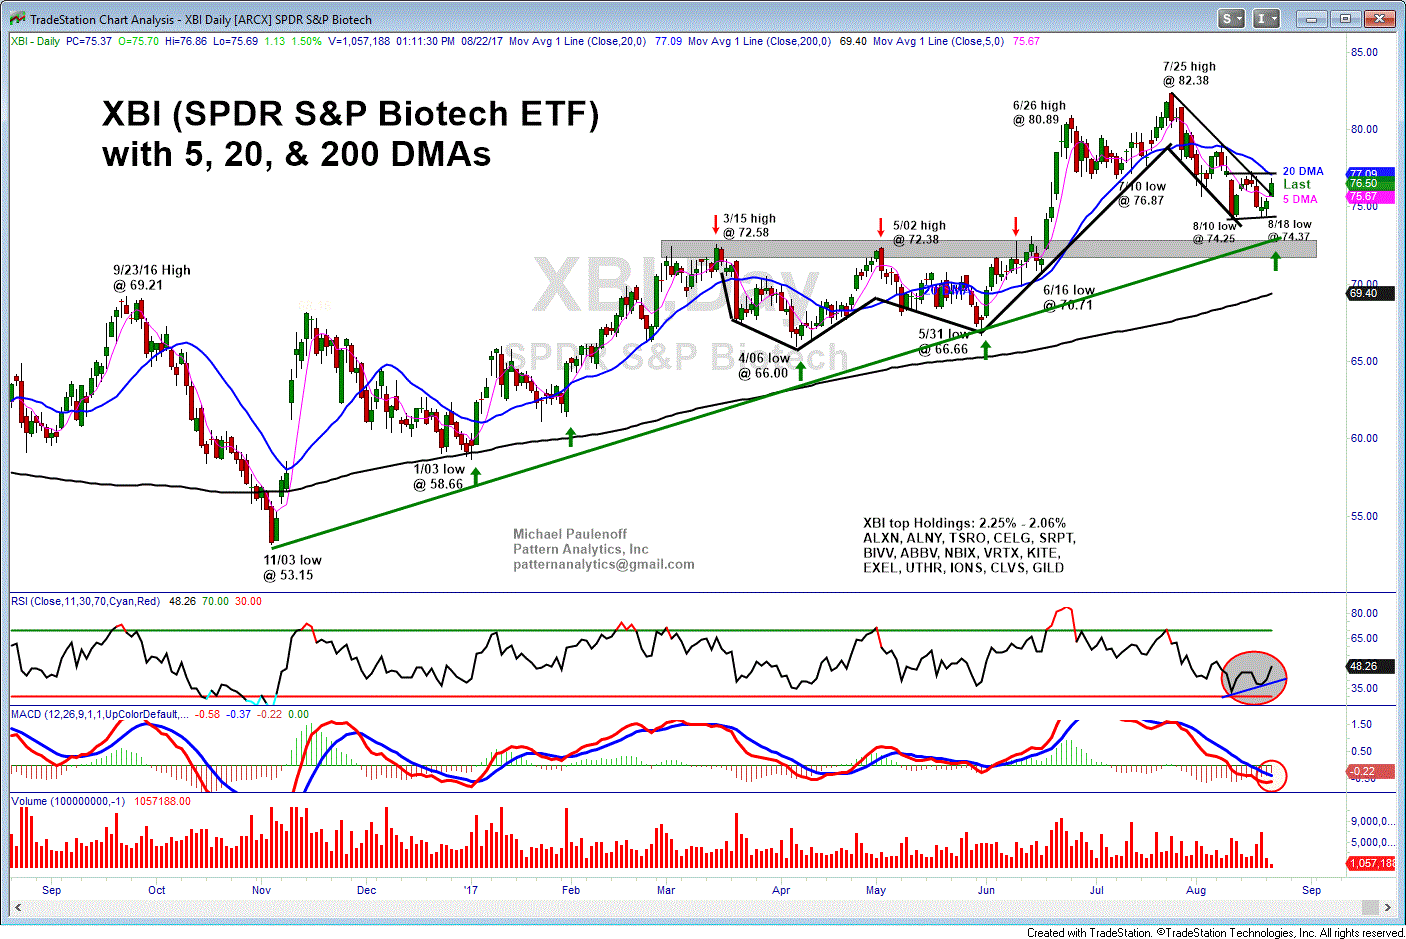
-- From a medium term XBI chart perspective, let's notice that since the Nov. 2016 pre-election low at 53.13, XBI has carved-out a series of higher-lows that constitute a major up trendline that remains intact and viable, and so far has contained the most recent bout of weakness from 82.38 to 74.25. As long as XBI weakness preserves the 74.25 to 73.00 support zone, the dominant 10 month uptrend will remain the most important feature of the technical set up, and for the time being, is attempting to compel the XBI price structure into a big U-turn that has the potential to result in a new upleg that projects next to the 84.00 target zone.


