NFLX Follows My Optimal Technical Price Path-- To the Downside
 By
Mike Paulenoff
By
Mike Paulenoff
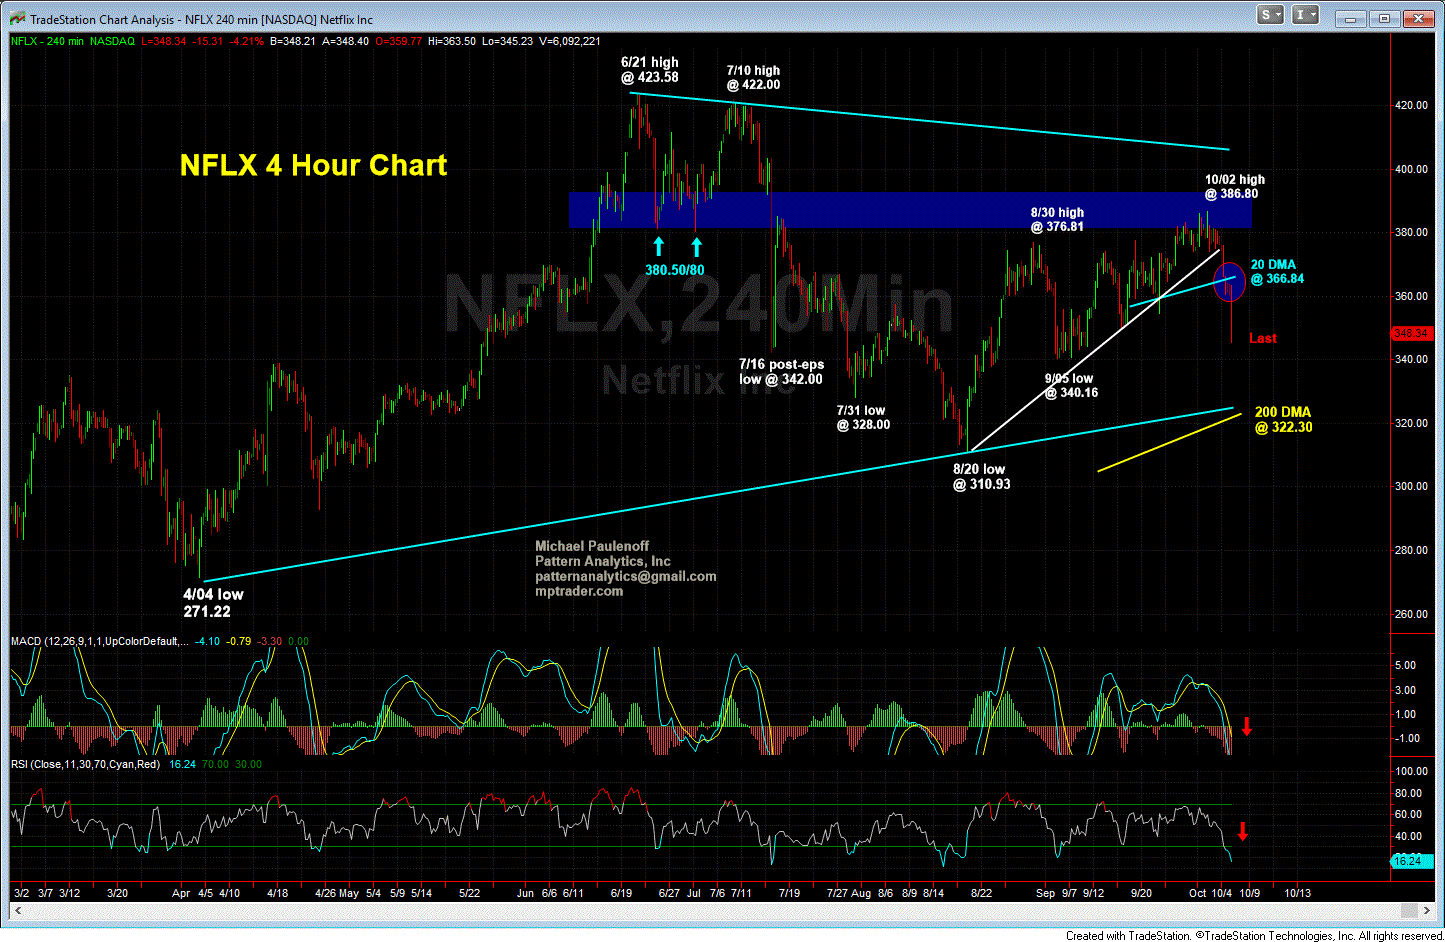
Back on Oct. 3rd (Wed.), we discussed the following about NFLX when it was trading around 378.50...
FAANG Focus: NFLX-- Back in July when I waded into a long position after what I thought was a completed acute corrective period from 423 to 328, ahead of a bounce to 390-400, NFLX had another loop down up its sleeve, which pressed the stock to 310.93 (8/20/18), which finished a 20%, eight week haircut.
Since the 310.93 low, NFLX has climbed to yesterday's recovery high at 386.80 (+24%) in a move that looks to me like it is huffing and puffing, exhibiting serious upside fatigue. That said, however, as long as any NFLX weakness is contained 374.7585, the recovery rally pattern will remain intact, notwithstanding its fatigue.
Right now, my pattern and momentum work argue that all of the action in NFLX from the August low to the Oct. high represents a completed recovery rally effort ahead of another bout of weakness amid a larger, still-developing major corrective process off of the June high at 423.58.
Caution is the word in NFLX here. In the absence of a new bullish catalyst, NFLX is on borrowed time in my "technical opinion." Last is 378.49/60
Forward-Fast to today, two-days later-- we see NFLX (see chart) has broken down, and is trading at 346.20, heading towards a test of key support at 340-34, which if violated, will point NFLX towards a full-fledged test of its 200 DMA, now at 322.30... .