NVDA Continues To Drive Locomotive Upside
Good Tuesday Morning, MPTraders! August 22, 2023-- Pre-Market Update: NVDA continues to drive the upside locomotive this AM...
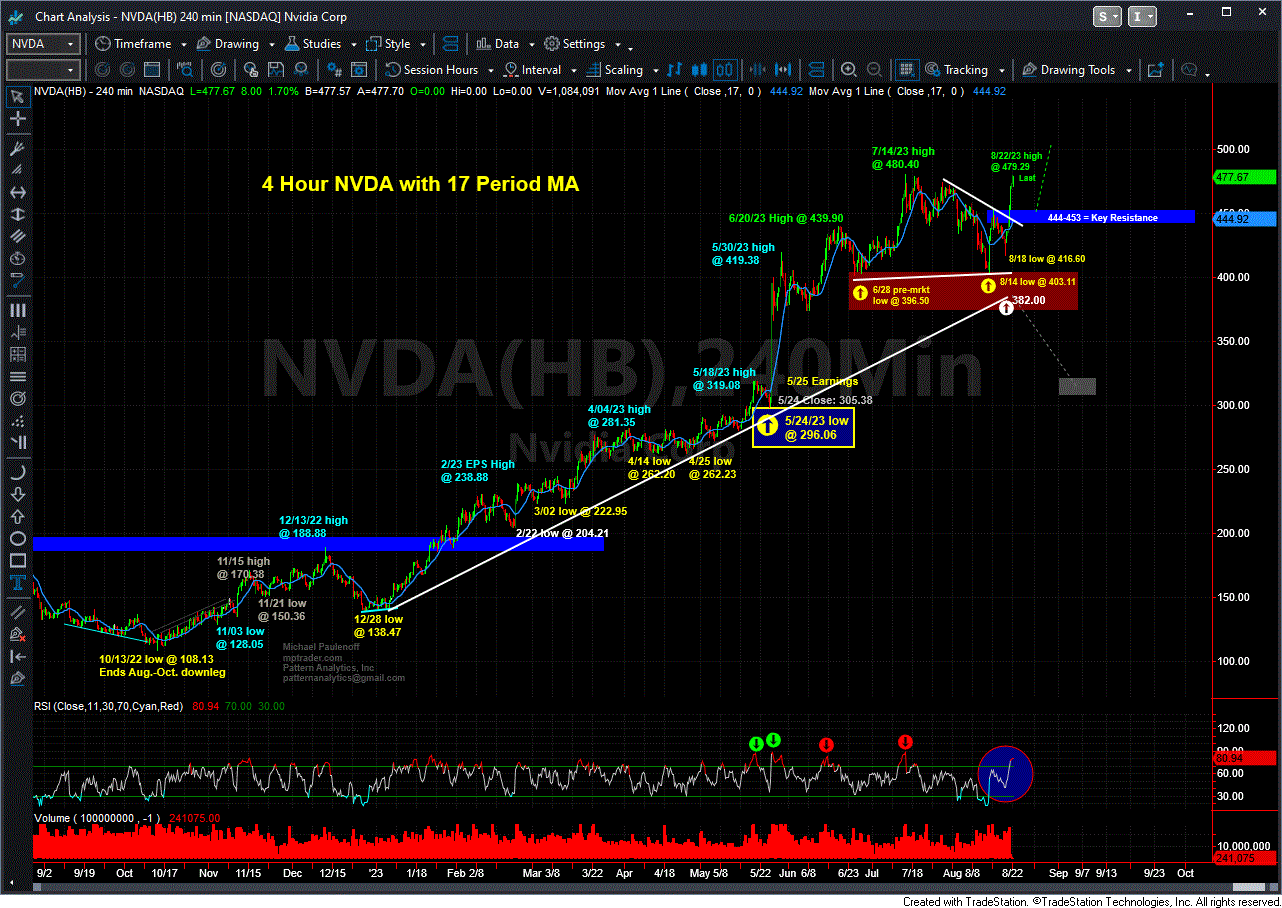
My attached 4-Hour Chart shows this AM's pre-market pop of another 2% to a high at 479.29, making the upmove just since last Monday's (8/14) low at 403.11 a cool 19%! More significantly perhaps is that NVDA is rocketing INTO tomorrow eve's earnings report, as if just about everyone expects AND knows that NVDA will announce another exceedingly bullish and exciting set of quarterly metrics that will have the potential to propel the stock MUCH HIGHER.
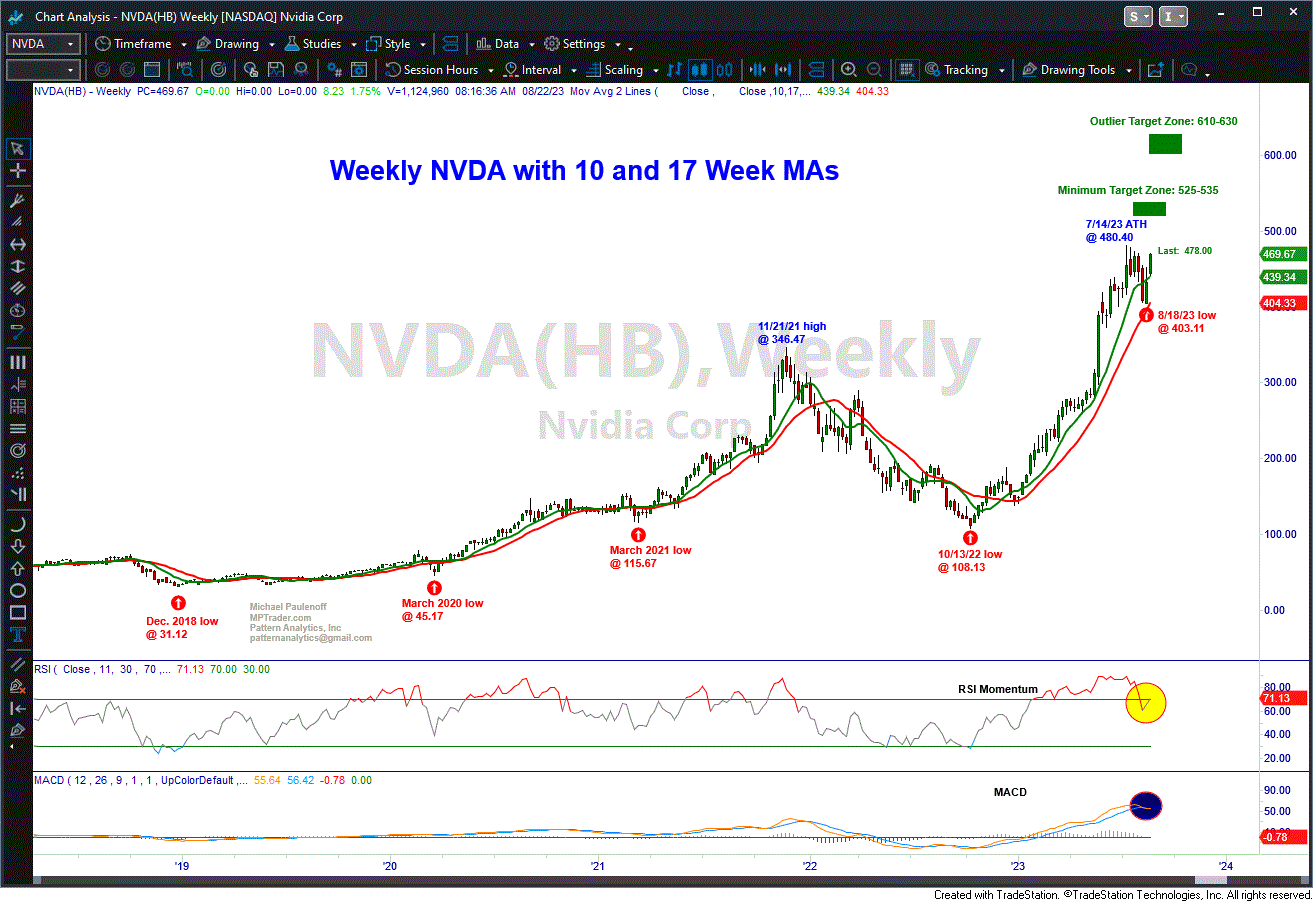
How much higher? Based on my longer-term pattern and momentum work shown on my attached Weekly Chart going back to 2018, the setup argues for upside continuation to a minimum target zone of 525-535 and an outlier target zone 610-630. Purely from a pattern perspective, a thrust to new highs will have the right look of the final upleg off of the larger advance from the October 2022 low at 108.13 and SHOULD BE ACCOMPANIED BY a GLARING NEGATIVE MOMENTUM DIVERGENCE (a lower-high in WEEKLY RSI) that will warn us that NVDA has reached upside exhaustion.
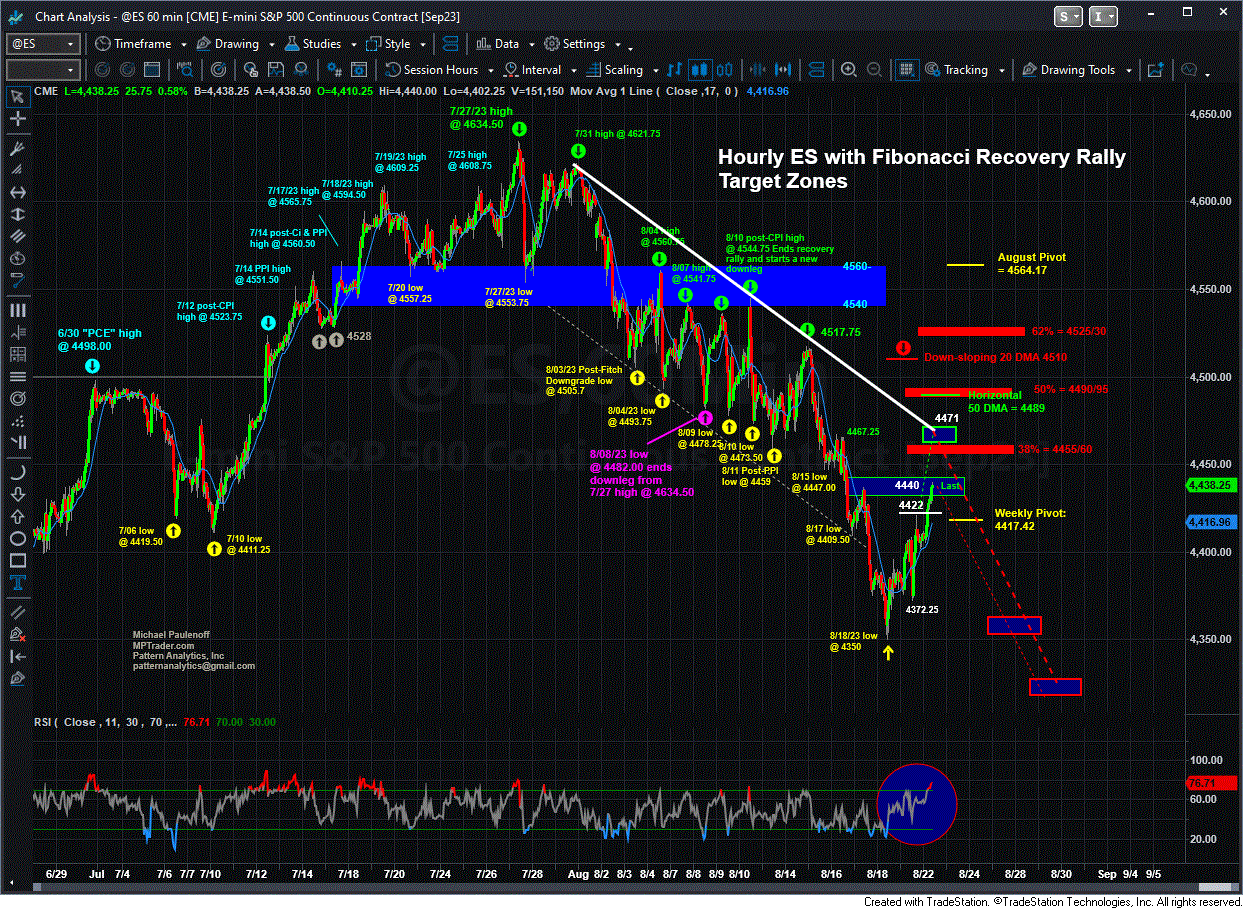
As for ES and SPY (see my attached Charts below the charts of NVDA), the strong upside continuation of yesterday's up moves has exceeded the Swing Target levels discussed yesterday at 4422 and at 441.20, respectively. ES has hit a recovery rally peak at 4440, which represents my next optimal near-term resistance zone, however, in that the upmove is confirmed by my momentum gauges, I am expecting ES to continue to challenge much more consequential resistance lodged from 4455 to 4470, which includes the Fibonacci 38% Recovery Retracement Level of the entire prior decline (4463.50 to 4350.00) and the dominant down trendline from the 7/31 pivot reversal high at 4621.75.
I have added the 50% and 62% Recovery Retracement Levels to the Hourly ES Chart in case the index manages to blow through the 4455-4470 resistance zone.
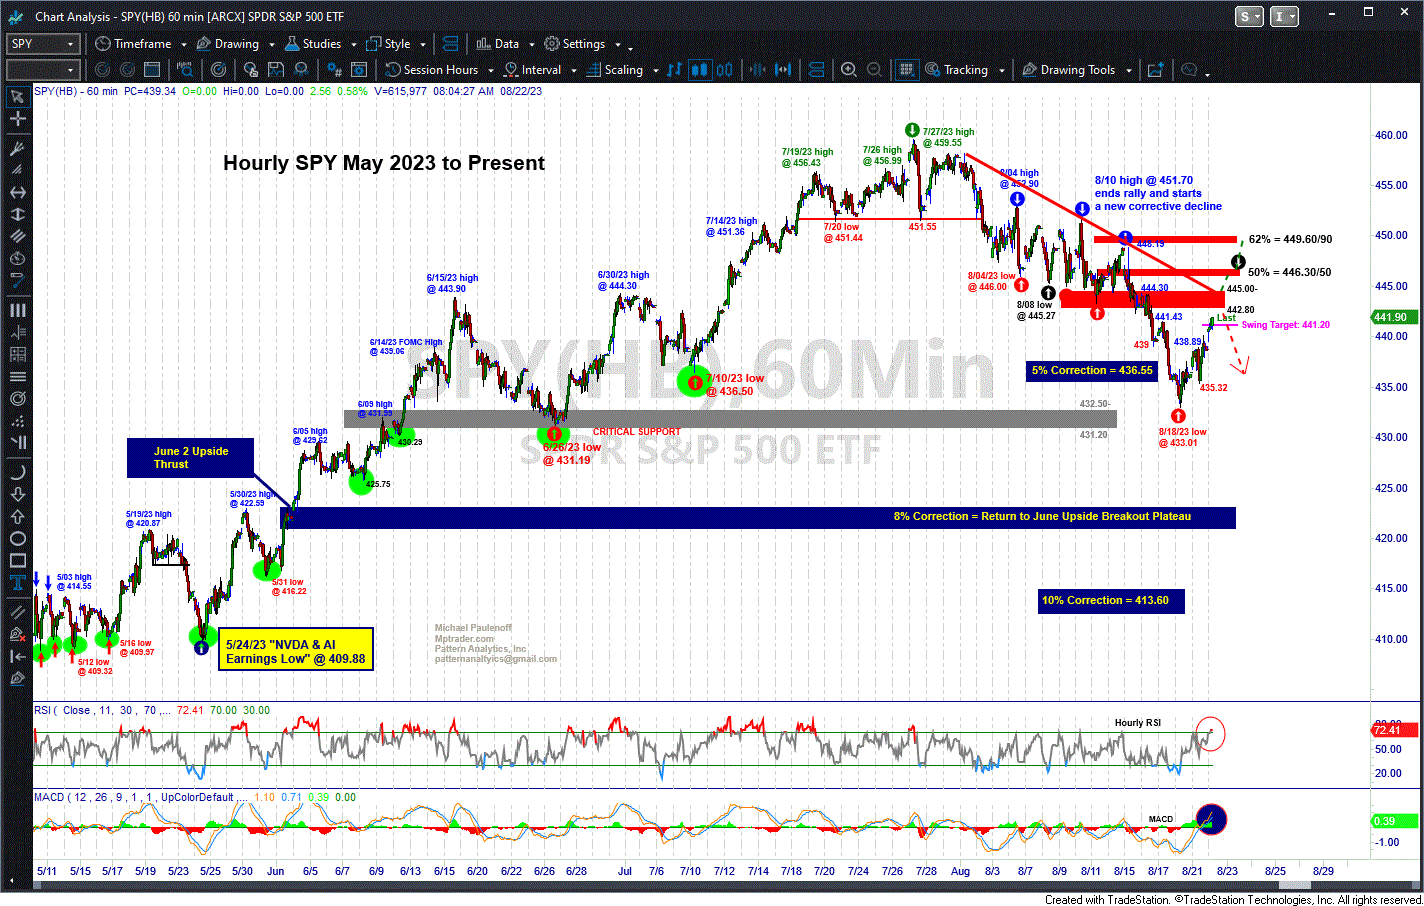
As for SPY, now that it has hurdled and sustained above its Swing Target of 441.20, all eyes should be watching for a challenge of much more consequential resistance from 442.80 to 445.00, which includes the 38% Fibonacci Recovery area and the dominant down trendline from the 8/01 pivot reversal high. If SPY manages to take out 442.80 to 445.00, then our focus will shift to the higher Fibonacci Recovery Retracement levels shown on my attached Hourly Chart.
At the moment, I am expecting both ES and SPY to peak and reverse from near or in their respective "more consequential resistance zones" of 4455-4470, and from 442.80-445.00, and thereafter, to roll over into serious downlegs that resume the dominant downtrends off of their July highs... Last in ES is 4436.50... Last in SPY is 441.73


