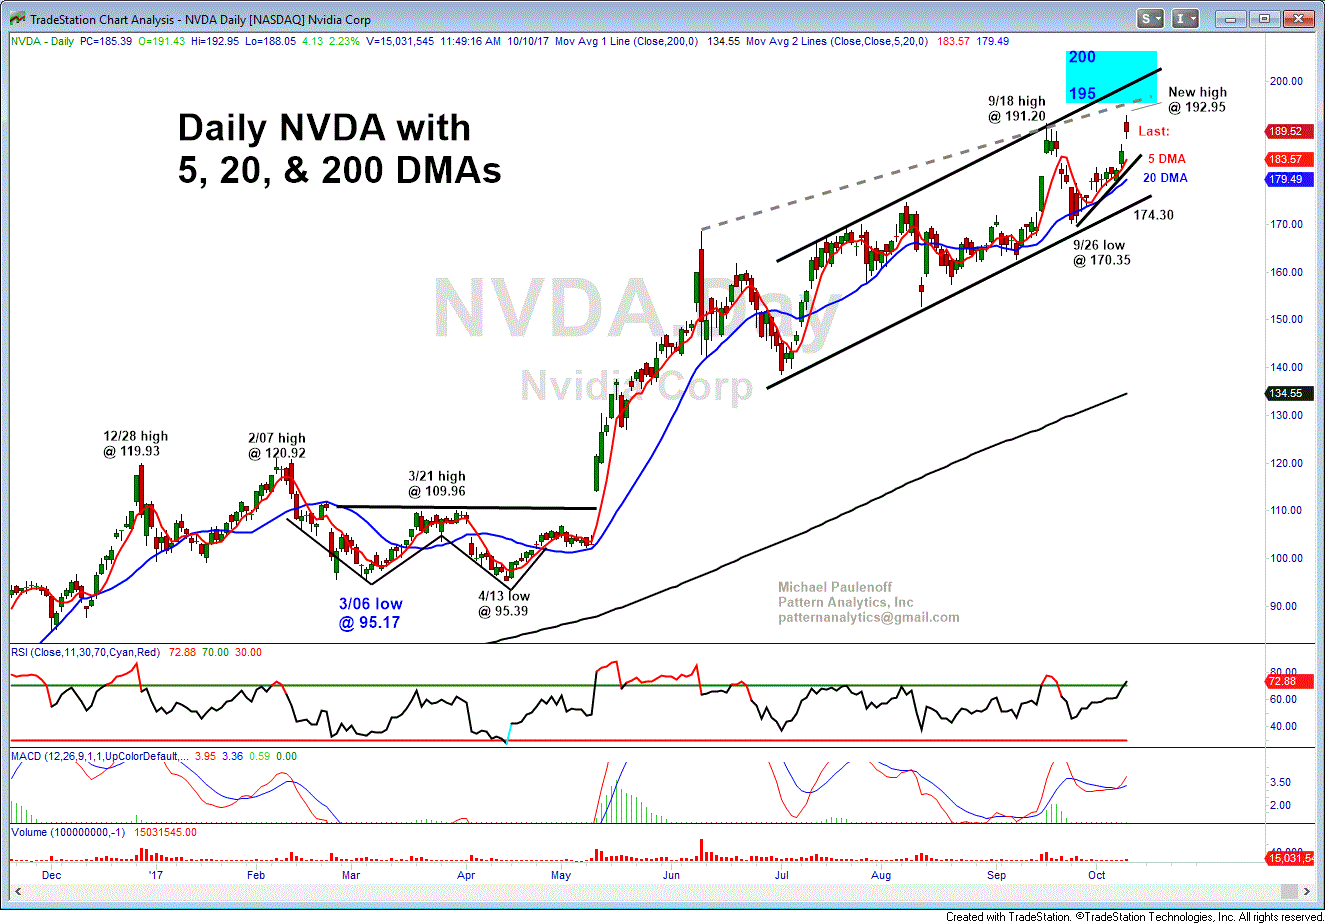
NVDA Nears The Next Target Zone Where A Major Correction Could Emerge
NVDA made another new all time high this AM, at 192.95. Based on the enclosed daily chart, all of the action off of the March 2017 pullback low at 95.17 represents the current upleg, which my work argues is nearing a significant peak in the vicinity of 195 to 200, which if reasonably accurate, will mean that NVDA will be vulnerable to a significant correction that will project from 195-200 into the 160-150 target zone.
From my perspective then, NVDA has upside of 3% to 4% versus downside of 20% to 25% from in and around current levels.
If I was long NVDA here, I would be trailing a protective stop just below 183.00. Last is 189.41/42

