NVDA and FOMO Hype of AI Leading The Market
Good Tuesday Morning, MPTraders! May 30, 2023-- Pre-Market Update: The vote for passage of the new debt ceiling legislation is scheduled for Wednesday after the markets close. To pass the bill, 150 Republican votes and 68 Democratic votes are needed (a lot of pressure is on Rep. Speaker McCarthy to deliver 70% of the House Republican votes to ensure passage)... There are two trading sessions remaining in May (prepare for end-month mark-ups and bullish window-dressing Wed. PM?)... After Wed.'s close and after the presumed passage of the new debt ceiling legislation, traders and investors again will be fixated on macro issues (inflation vs. deflation) and future Fed policy. Friday morning, we get the May Jobs Report to end the week... Otherwise, some big tech earnings are due out on Wed. afternoon as well: CRM, CRWD, and DELL...
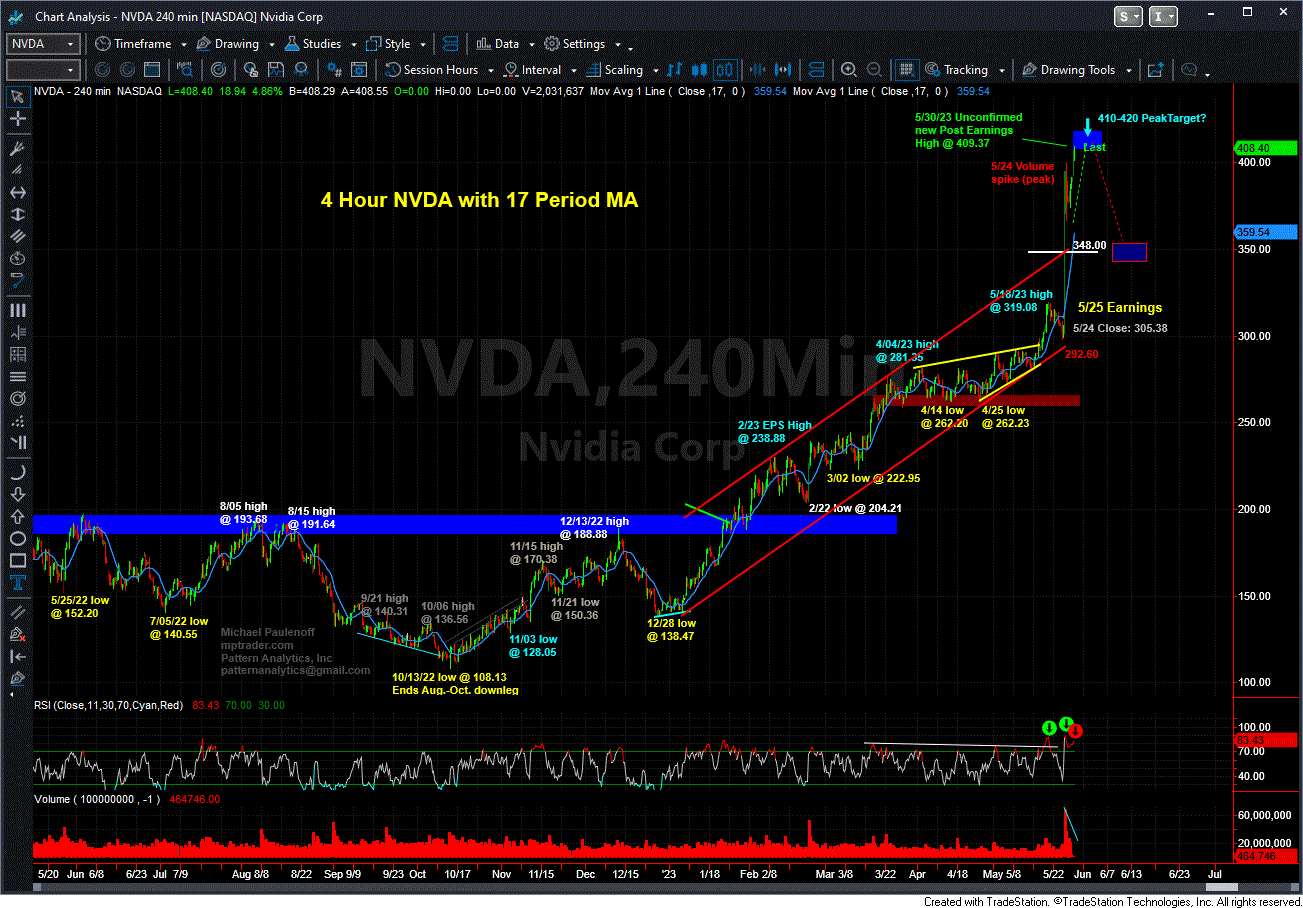
As for the markets, let's first take a look at the ongoing vertical assault pattern of NVDA (see my attached chart) in the aftermath of its shockingly bullish earnings report last Wed (5/24) after the close, from where the stock rocketed from just above 300 to this AM's new high at 409.37 (+34%).
At the moment, NVDA and the FOMO hype of AI are leading the market, so for now, as goes NVDA, so goes the Nasdaq in particular, but also the SPX...
Last Friday, my near-term pattern work indicated that after a brief rest-digestion period (above 350), NVDA should spike to one more new high above 399.50 into a projected target zone of 410-420 before my work indicates the current upleg could exhibit signs of near-term upside exhaustion.
This AM's thrust to a new high at 409.37 satisfies the minimum requirement of NVDA climbing above 399.50. The fact that it has neared the lower-bound of my optimal target zone of 410-420 AND the fact that my 4-Hour Momentum gauge is not (yet?) confirming the run to new highs are both warning signals that NVDA is starting to gasp for air atop a 279% upmove off of its October 2022 low at 108.13. My work will trigger initial downside reversal signals if and when NVDA breaks back beneath 399.50 AND THEN PROCEEDS TO FOLLOW-THORUGH TO THE DOWNSIDE BENEATH 387.60... Last is 408.03...
ES-- While it IS difficult to believe the indices will sell off in any material way before month-end (the next two trading sessions), we cannot rule out some increasing two-way volatility if some Republicans and Democrats public balk at the passage of the debt ceiling legislation during the upcoming 48 hours.
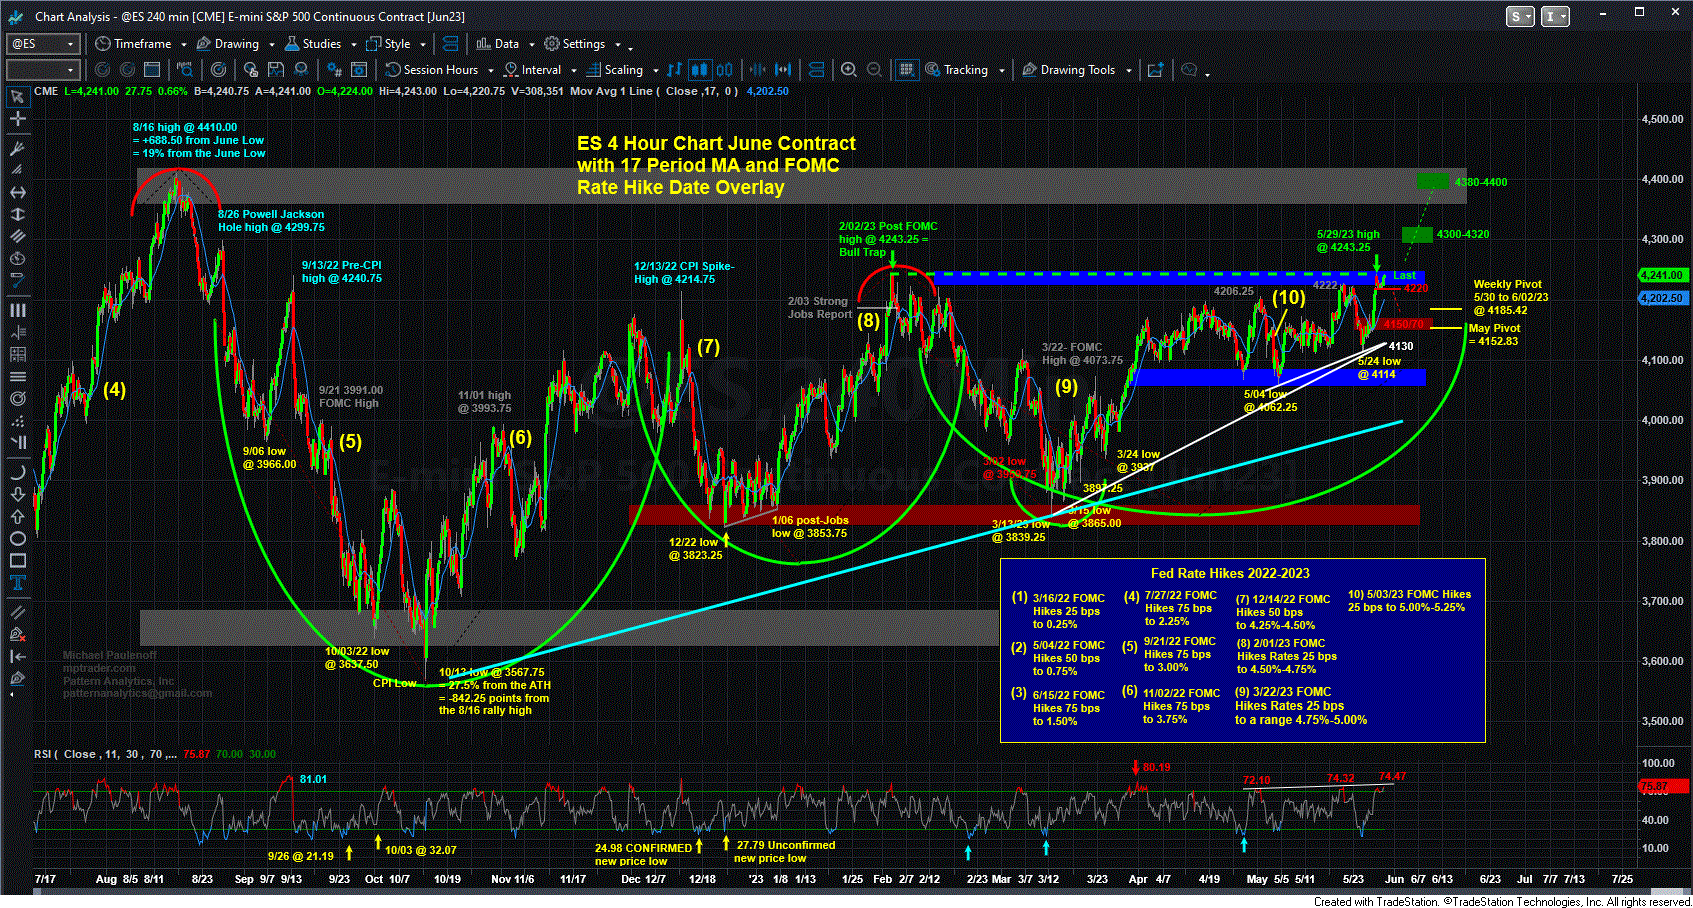
Purely from a technical perspective, let's notice on my attached 4-Hour Chart that yest.'s (market holiday) electronic trading high at 4243.25 EXACTLY MATCHED prior significant rally peak hit on 2/02/23, but so far has been unable to climb above the Feb. 2022 high. Unless ES breaks and sustains beneath nearest support at 4220, the current setup argues for higher-highs into the 4260 area next, but thereafter, 4300 to 4320 will be on the table.
That said, however, a sustained breach of 4220 will indicate that last week's (NVDA) vertical thrust from 4114 (5/24) to 4243.25 (+3.1%) is laboring, and as such, is vulnerable to additional pullback into more consequential support lodged from 4150 to 4170... Last is 4239.00...


