New Upleg Within Longer-Term Bull Market In Progress?
 By
Mike Paulenoff
By
Mike Paulenoff
Fellow members FJB and Option Seeker have been engaged in a discussion about long-term resistance (and Put Option positions) in SPY (SPX, ES) that could put a lid on the post-April upmove in and around current levels at 530 SPY and at 5300 in the Cash SPX.
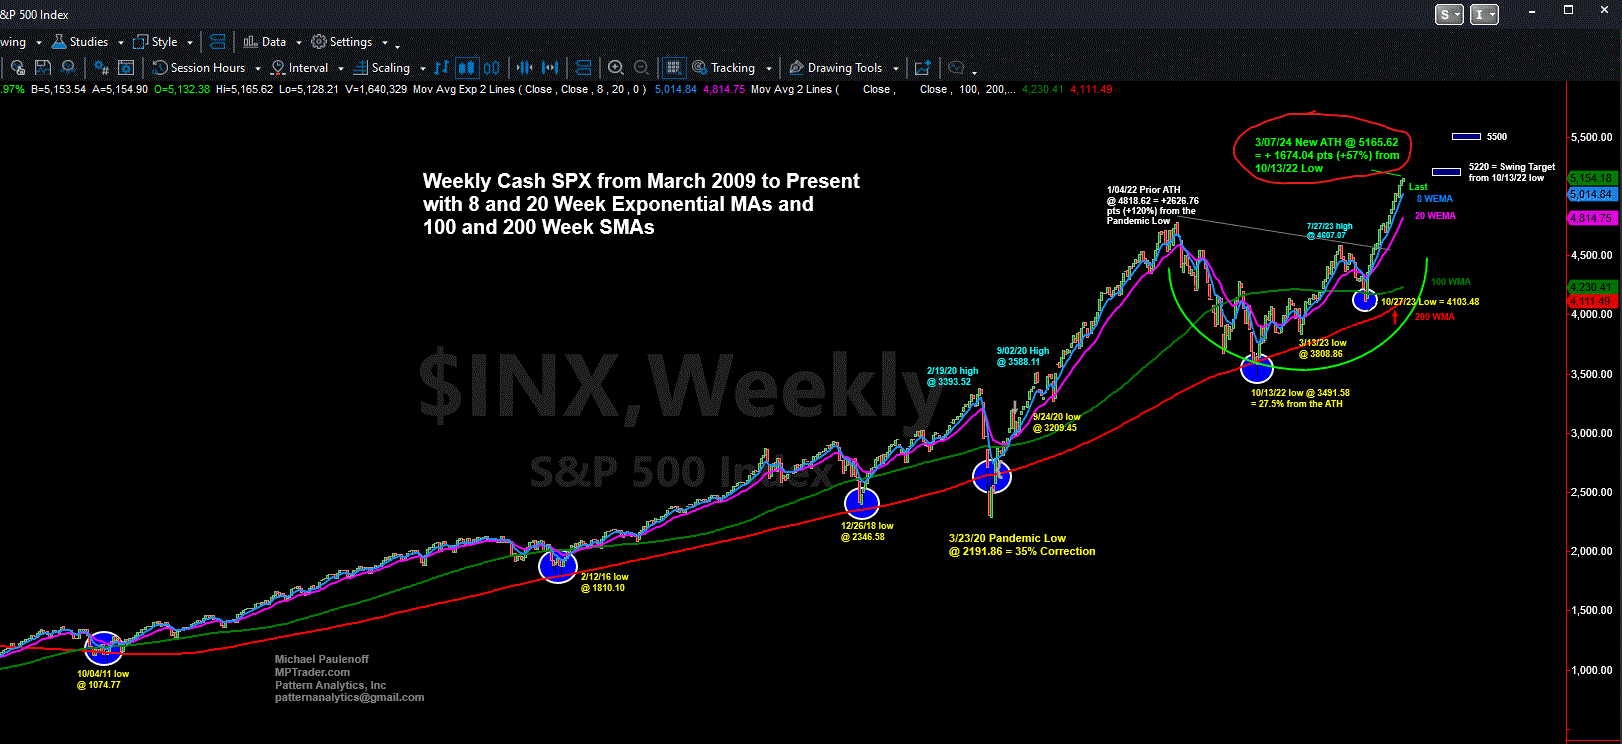
I would like to weigh into the discussion with my longer-term chart setup in the Cash SPX. Here is my most recent post of my analysis of the Weekly Cash SPX from March 7, 2024:
Cash SPX BIG BIF Picture: If I am a long-term investor just using my attached Weekly Chart for technical guidance, what is it telling me right now? Stay long with a Stop under 5000 looking for a next target zone of 5220, which is the next ATH-zone from where the technical setup will have reasons reverse into a correction of around 4%, but if 5000 is violated and sustained, then a deeper, scarier correction will unfold into the 4750-4800 target window (8%-9%). If a 4%, relatively shallow correction unfolds from 5220 to 5000 (or above), and SPX turns up again, then my next higher target zone is 5500... Last is 5158.64...
Here was the Chart Setup on March 7, 2024...
Now scroll down to the Chart as of a few minutes ago on 5/16/24 (continued below the upper chart)...
From a pattern perspective, since the March 7th version of the Weekly Chart, SPX has satisfied a 6% correction into the 4/19/24 low, and thereafter, has "gone vertical" in a relentless assault that has propelled SPX to a new ATH TODAY at 5314.83 that looks very much to me like a new upleg within the longer-term bull market is in progress.
Weekly Momentum is not confirming the new ATHs, however, which IS a concern. That said, Weekly Momentum is pointed straight up, and tells us that it may yet be "rehabilitated" and play catch-up to the new ATHs in price. At the very least, in the absence of full momentum "rehabilitation," Weekly Momentum needs to TURN DOWN before the current non-confirmation sends a "danger signal" to the bulls.
In other words, my sense from looking at this setup on the Weekly Chart is that SPX is as likely or more likely to be in the grasp of a vertical melt-up than it is an exhaustive technical condition...
Be careful trying to pick a top... Last in Cash SPX is 5314.65 off of a new ATH at 5316.09 as I am typing this update... MJP