
Newton: A body in motion will stay in motion until an outside force acts upon it...
 By
Mike Paulenoff
By
Mike Paulenoff
With all due respect to Sir Isaac, allow me to amend his Law of Physics as it applies to Price Behavior: A price trend in motion will stay in motion until an outside force equal to or greater than the underlying directional trend halts its progress and/or reverses it.
Therein lies the question investors find themselves pondering at the moment: Is such a countervailing force developing that has the power to reverse one of the strongest (+12%), fastest market melt-ups in 100 years (20 trading days so far from Monday, October 30th to Monday, November 27th, 2023)?
Allow me to offer a two-word answer: Not yet.
First, let’s make a list of the positive and bullish market influences that reversed the 8.5% August-September 2023 decline in the first place:
— An early November Quarterly Refunding that required less Government borrowing than expected…
— An FOMC Meeting (11/01/23) that resulted in a less hawkish, “kindler, gentler” Fed policy prescription and a less draconian Powell press conference that indicated the Fed has shifted to a "wait-and-see” posture on another rate hike…
— Growing perceptions on Wall Street that the Fed was finished with its 19-month FOMC rate hike cycle, and the possibility of a rate cut in early 2024
— A weaker than expected Jobs Report for October…
— Continued “disinflation” to beneath 4% from 9% one year ago that reversed 10-year yield from 5% to 4.50% in a matter of hours…
— A sharp downside reversal in 10-year Treasury yield from 5%— a 16 year high in Benchmark longer-term US bond yield to 4.25% in 5 weeks…
— Two months of de-risking by Portfolio Managers that left them grossly underweight equities entering November…
— A huge short equity position accumulated by retail futures and options traders…
— An expansion in equity market breadth (the relatively rare but potentially very bullish Zweig Breadth Thrust) …
— The year-end (October-December) bullish equity seasonal finally kicking in, albeit a bit later than expected this year…
— Earnings that held up better than expected indicating that should the Fed take its foot off of the monetary brake just slightly— either in word or in deed— corporate profits and profit margins will expand…
— Crude Oil prices cratering even despite the Israel-Hamas War…
— Persistent weakness in the Chinese Economy…
I suspect I left out a few items that also influenced the vicious upturn in equity index prices, but in any case, you get the gist of equity market conditions at the end of October 2023…
Now the question is after the near-vertical 4-week price assault on the upside has the Cash SPX slammed into an immovable force capable of repelling additional equity market strength?
To attempt to answer the question, let’s take a look at some chart pictures that will help us arrive at a conclusion:
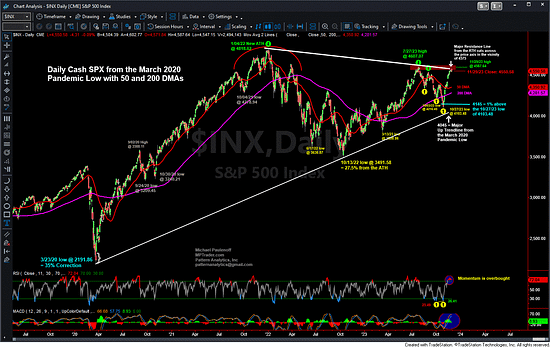
— My Daily Chart of the Cash SPX (see below) shows that the October-November 2023 vertical advance is now smacking into the down trendline (resistance line) that originates at the January 2022 All-Time High of 4818.62 and cuts across the price axis tomorrow (11/30/23) in the vicinity of 4575. Although SPX attempted to trade above the resistance line today (at 4587.64), by the closing bell, the resistance line had repelled the strength, leaving SPX to close at 4550.58. For the time being then, the major down trendline from January 2022 is acting like an immovable force on the upside capable of reversing the recent advance…
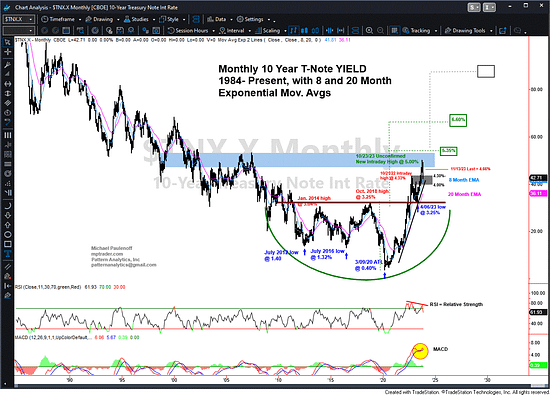
Next, let’s see if the downside reversal in Benchmark 10-year yield from 16-year highs at 5% has pressed to a very significant level where we would expect longer-term yield to be considered “cheap.” Based on my attached near 40-year chart on monthly yield, 3.90% to 4.00% is the zone from where my work argues the decline from 5.00% will find powerful demand. For the time being then, the falling 10-year bond yield has more room on the downside before it becomes part of an immovable force preventing equity prices from climbing further…
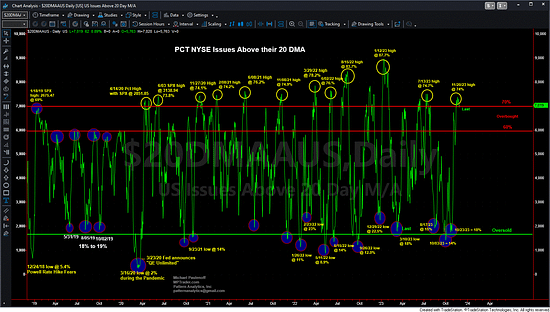
Next, let’s take a look at a couple of market breadth gauges. First, the percentage of NYSE stocks trading above their 20 DMAs (see chart below). Wow! The percentage has climbed from a very sparse and oversold level of 18% on 10/23/23— just ahead of the SPX low at 4103.78 recorded on 10/27/23— to last week’s (11/20/23) abundant and overbought high of 74%! For the time being, this extremely overbought short-term breadth gauge is warning us that the vast majority of stocks on the NYSE have participated in the October-November rally, at least enough to propel them above the sensitive 20 DMA. This condition does qualify as a warning sign that the SPX has smacked into a near-term immovable force…
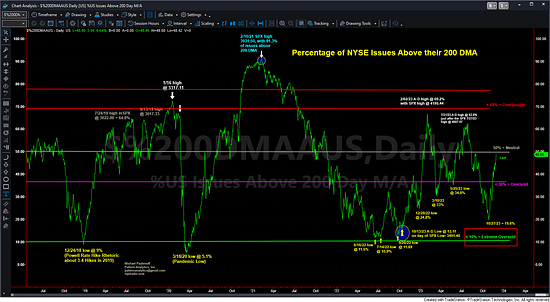
Second, what about the percentage of NYSE stocks trading above their least sensitive 200 DMA? Hmm, this picture (see below) offers us a different perspective on whether equities have more room to run prior to meeting an immovable force. In fact, the percentage of NYSE stocks above their 200 DMAs has climbed from an oversold 19.6% on 10/27/23 (the day of the low in the SPX) to 48.8% at today’s (11/29/23) close, which registers a Neutral reading at best. This suggests that SPX has more room to run on the upside before the percentage of stocks trading above their 200 DMAs climbs into overbought or near-overbought conditions. In other words, this breadth condition is a ways from indicating the SPX has hit a level of immovable force capable of reversing its uptrend…
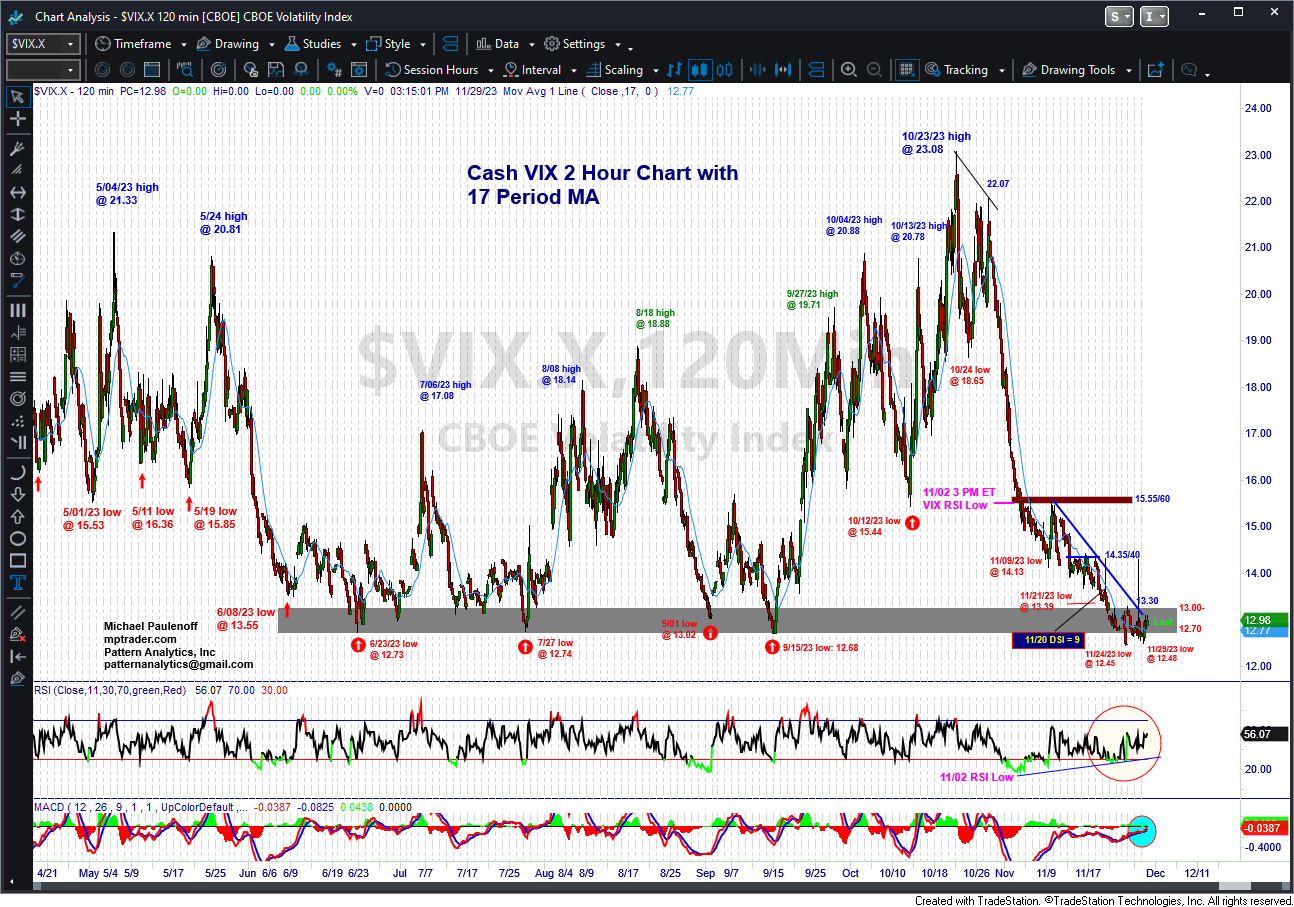
How about the Cash VIX? From its 10/23/23 high at 23.08, VIX has plunged to 12.45-12.48 lows during November 2023, which is usually considered an extreme level of complacency that inevitably results in an eruption of volatility that sends the SPX reeling to the downside. That said, however, so far VIX has spent the past week submerged beneath 13.30, which has had little repellent impact on SPX behavior that remains perched for the past week in the upper 10% of the October-November advance. Nonetheless, my sense is that an upside reversal thrust in VIX is approaching very soon (VIX is behaving like a submerged beachball below 13.30), and as such, I consider a VIX level of 12-13 an immovable force that will repel the SPX and is warning us about a reversal in Index…
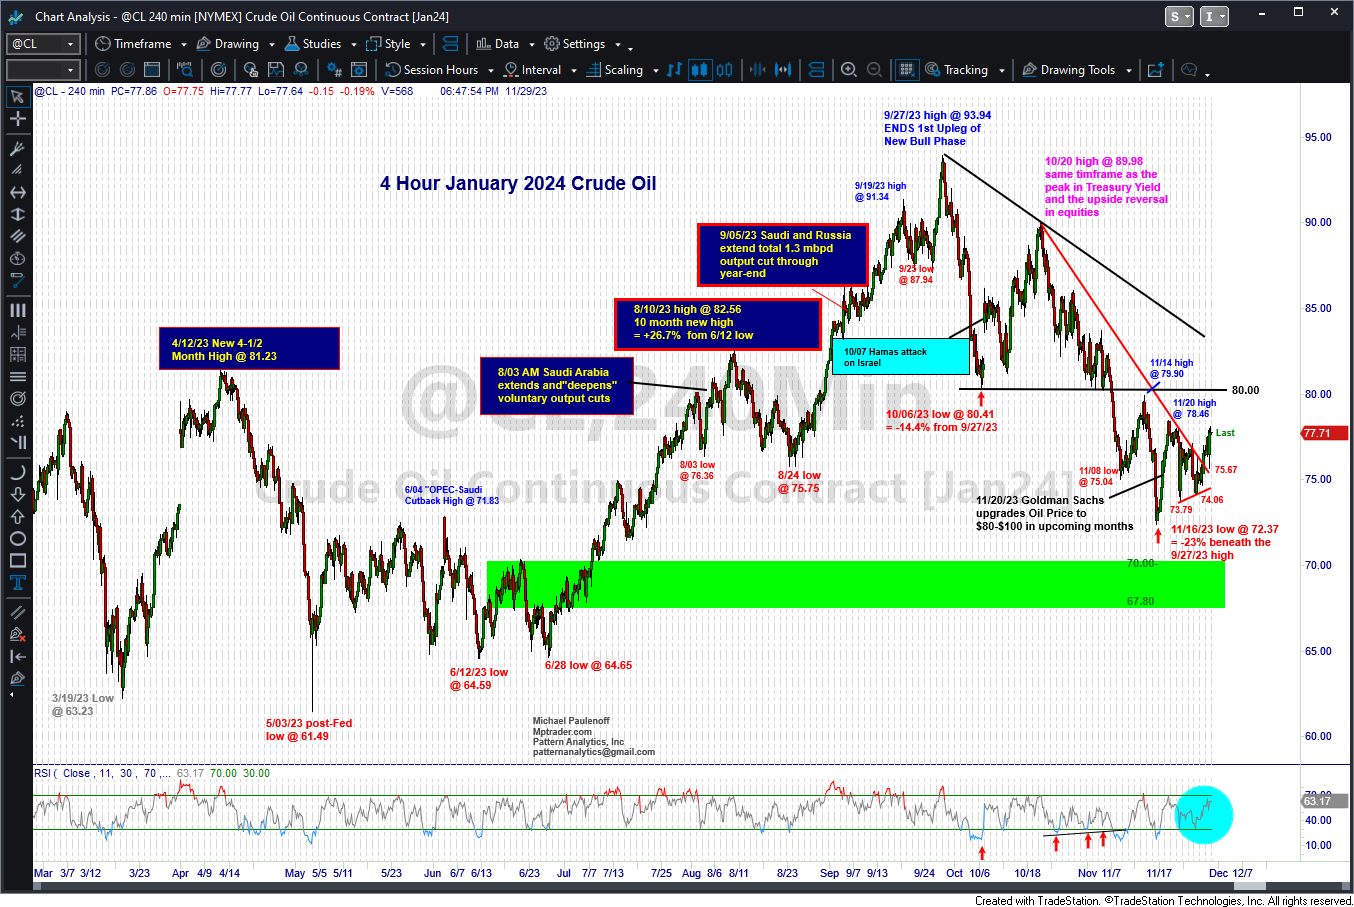
Finally, what might the behavior of Oil prices tell us about the direction of SPX? During the 12% advance in the SPX from 10/27/23 to 11/29/23, for most of that time January Crude Oil was declining from $90/bbl to a $72.37 low on 11/16/23, a 20% haircut, which no doubt fueled lower bond yields and higher equity prices. Since the mid-November low, however, January Crude has recovered over 7% of its lost ground and exhibits a technical setup that points to a run at $80.00 at a minimum (and perhaps to $85-$90/bbl if OPEC successfully reduces output yet again). At the moment, the price of Crude Oil definitely is not an immovable force that will hinder higher equity prices. However, should Oil head closer to $90+, then it will become more of a hindrance to rising equity prices… (continued below my Oil chart)…
Based on my little exercise here, my conclusion is that while traders and investors might be “afraid” that a vicious price reaction to the 12%, 5-week near-vertical advance in SPX is approaching fast, the weight of evidence argues to the contrary— that not enough adjacent markets, indicators and gauges are at “immovable force levels” (yet) to suspect a major top in the SPX will unfold in the hours directly ahead…
A brief pullback triggered by a negative reaction to tomorrow’s PCE price deflator data and to the OPEC meeting is more along the lines of the intensity of an adverse SPX price action.