Out Front: PPI for February Ahead of Tomorrow's FOMC Meeting...
 By
Mike Paulenoff
By
Mike Paulenoff
Tuesday, March 15, 2022-- Mptrader.com-- Out Front: PPI for February Ahead of Tomorrow's FOMC Meeting...
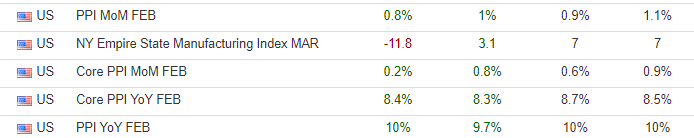
The latest "official" intermediate-term goods inflation figures for PPI were released a few minutes ago. The Street was expecting annualized PPI to print 9.7%, but the headline figure came in at 10%! (See the details below).
As for the reaction of the markets, neither YIELD nor ES reacted negatively to inflation data that came in very hot, but not hotter than expectations, which has caused a sigh of relief (certain among the Fed Heads as they start their two-day FOMC Meeting) amid bond and stock traders this AM (so far).
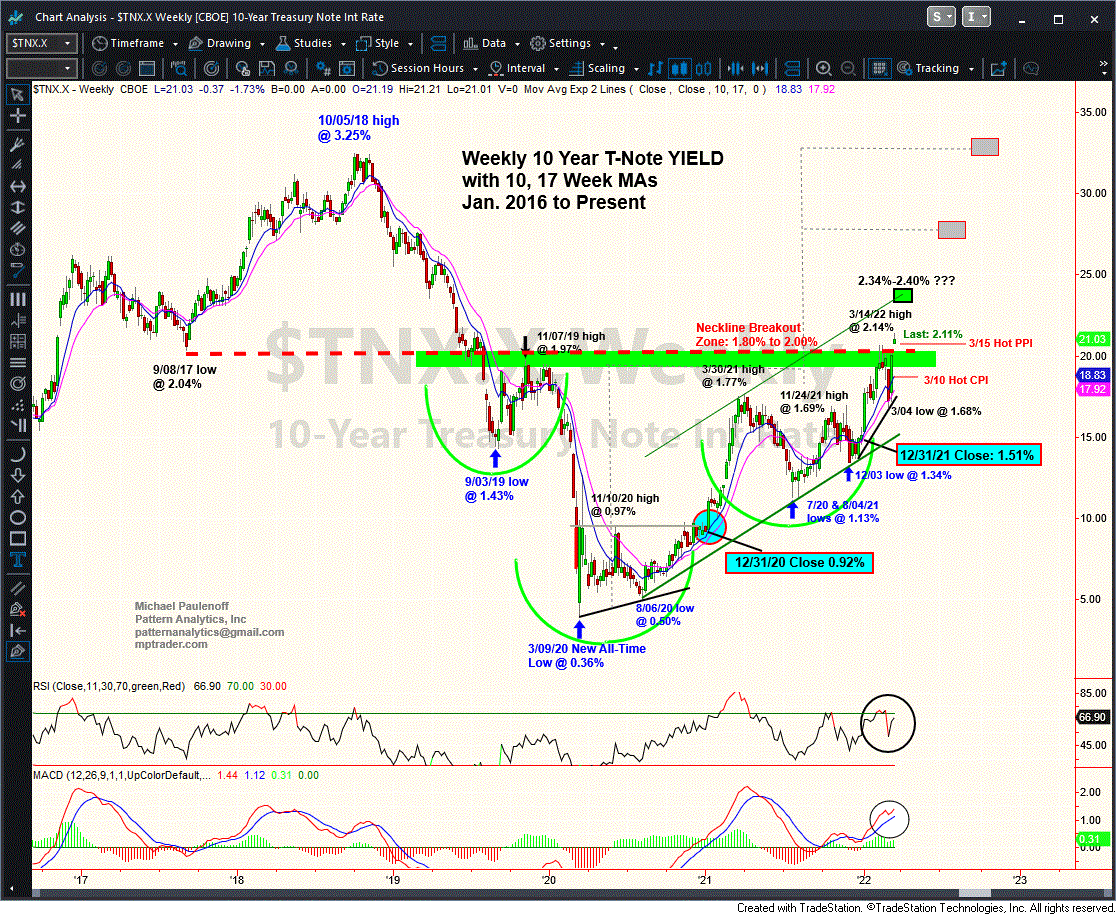
That said, however, my attached BIG Picture chart of 10 year YIELD shows that the yield structure has thrust above a 2-1/2 year resistance zone at 1.85% to 2.00% that from a pattern perspective, triggers upside potential derived from a massive (Inverse Head & Shoulders) accumulation period that projects to future upside targets in the vicinity of 2.35-2.40%, 2.80%, and 3.30%. These potential targets might appear outrageous and even ridiculous to some, but I will never doubt the veracity of a major breakout unless and until the pattern is invalidated. To do so in this case, 10 year YIELD will have roll over and decline beneath 1.68% for starters for the otherwise "bullish" intermediate term YIELD set up to elicit doubt.
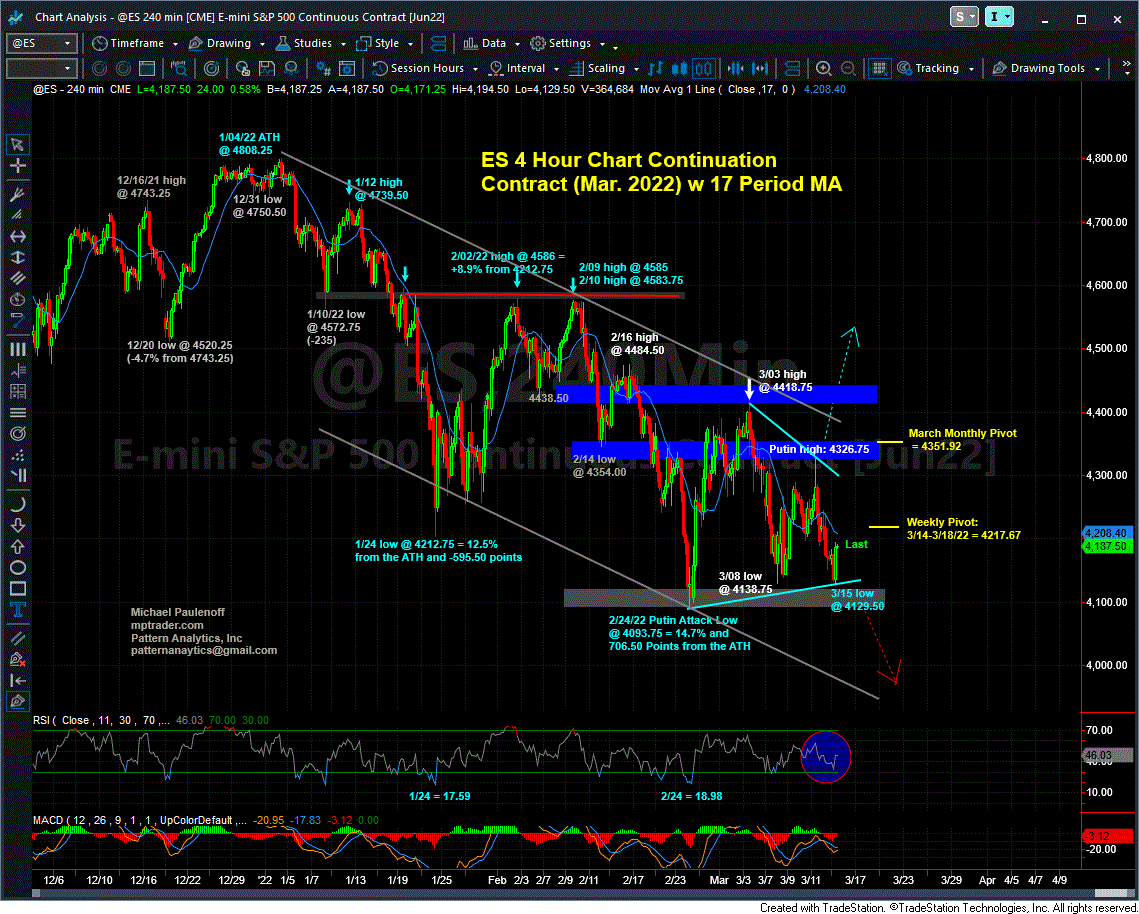
As for ES, in pre-market, pre-PPI trading, it pressed to a new reaction low at 4129.50 from Friday's wicked "Putin" Bull Trap High (Reversal) off of 4326.75, BUT there was no downside follow-through towards a full-fledged retest of THE MAJOR CORRECTIVE LOW at 4093.75 established on 2/24/22.
The lack of downside follow-through beneath 4129.50 followed by the rebound to 4194.50 so far is the initiation of a recovery rally that will provide us with VERY IMPORTANT INFORMATION about the health of the equity index (ES), especially ahead of the Fed policy statement tomorrow afternoon.
If the intraday pattern carved out off of this AM's low at 4129.50 exhibits bullish form throughout today's trading, and ES closes strong, then we should take it as a hint that the 2/24 low at 4093.75, the 3/08 low at 4138.75, and today's low at 4129.50 represent a meaningful near term Double or Triple Bottom that has the potential to propel ES to and above last Friday's "Putin Bull Trap High" at 4326.75, which if hurdled, will improve the technical set up significantly, and project a still larger retracement recovery rally of the Jan.-Mar. corrective leg from 4808.25 to 4093.75.
Conversely, either the inability of ES to rally much further today and or should the intraday pattern exhibit "sloppy" rather than bullish form, then we should fasten our seat belts for a resumption of weakness that projects below 4000... Last is 4188.25
Actual Previous Consensus Forecast (Trading Economics)