Positive Technical Sign for SGMO
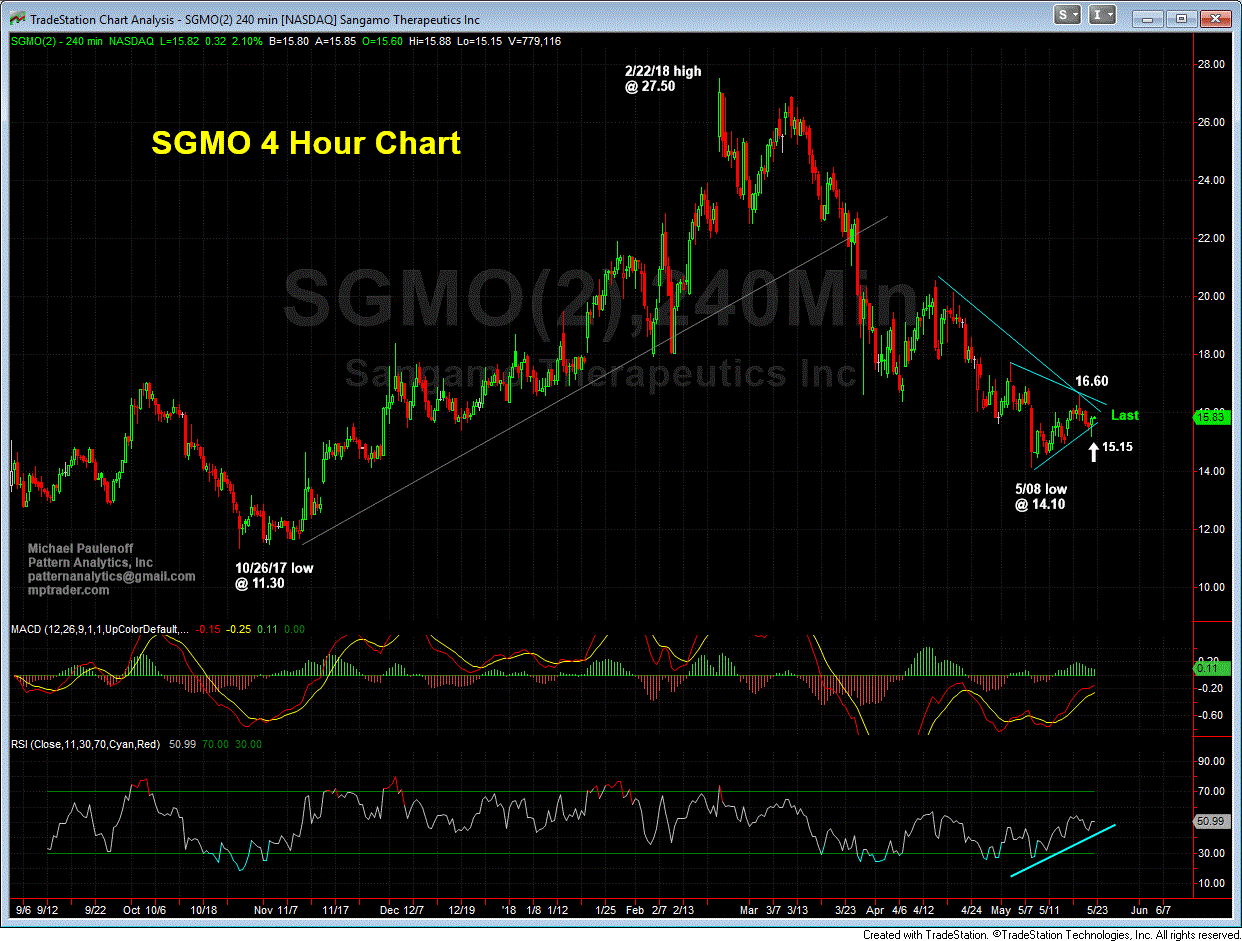
SGMO-- has clawed it way into the green after trading down to a low at 15.15, which we see on the enclosed chart represents a violation of the nearest term support line off of the the 5/08 low at 14.10.
That said, however, SGMO did not follow-through to the downside after breaking the support line, and instead has climbed to 15.70/75.
Although these are innocuous micro price moves, the inability so far of SGMO to gain downside traction beneath 15.40 is a positive technical sign that is not much selling pressure under 15.40, and that all of the action during the past two weeks is part of a bottoming process or a holding pattern ahead of forthcoming news about its gene editing cell therapy aimed at eradicating sickle cell disease.
While investors await anticipated news during the June to August timeframe, a climb above 16.25 (the price of its recent secondary offering) and thereafter a sustained climb above 16.60 will trigger near term buy signals that will point initially to 20-22... Last is 15.70/75

