
Positive Technicals for Biotech
 By
Mike Paulenoff
By
Mike Paulenoff
Biotech-- XBI Refresher from yesterday's 15:22 PM post...
Let's notice on the XBI Point & Figure Chart that the price structure has printed at a new near term rally high at 82.60, which triggers a near term buy signal, while on the daily chart, let's notice that XBI has sprung off of its 5 DMA above its down-sloping 20 DMA (82.21),which if sustained into the close will be a very positive technical action ahead of a test of its Oct. - Nov. resistance line, now in the vicinity of 83.50
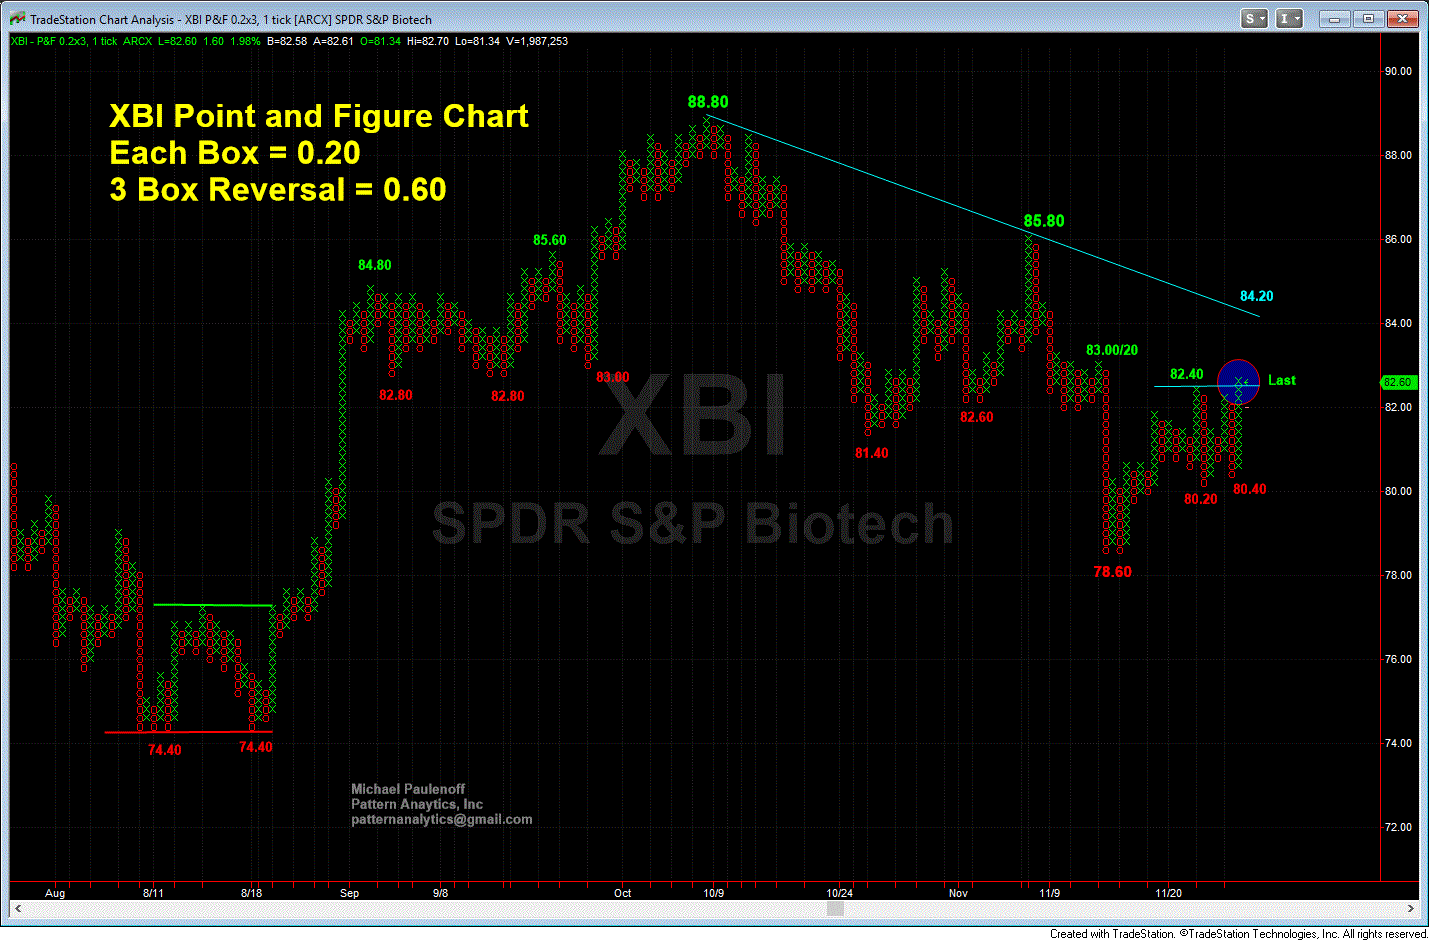
11 30 17 XBI PF chart 1140 GIF
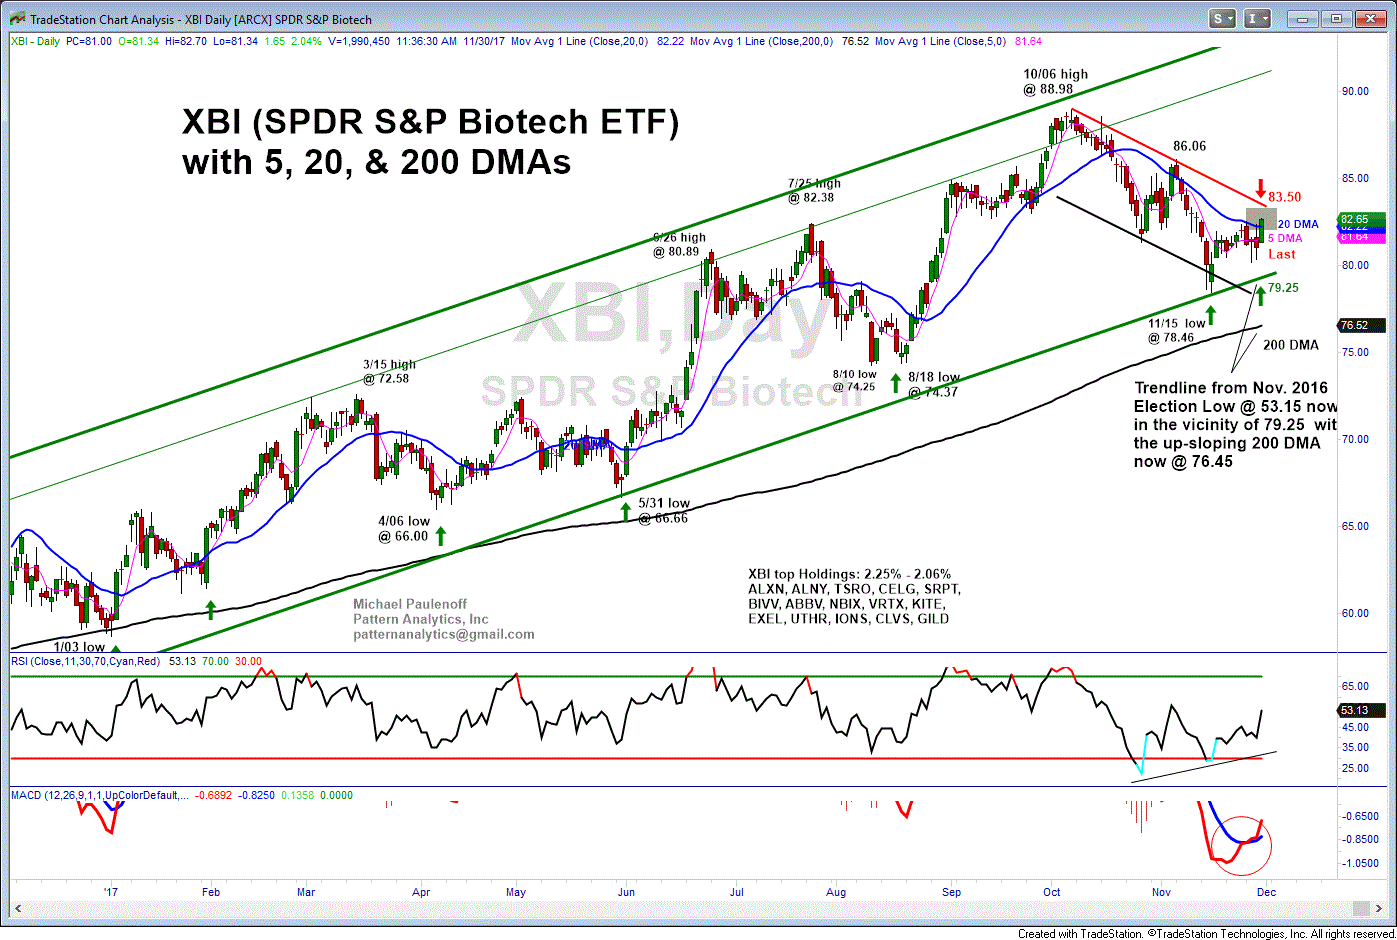
11 30 17 XBI Day GIF