Preliminary Upside Reversal Signals for TLT
 By
Mike Paulenoff
By
Mike Paulenoff
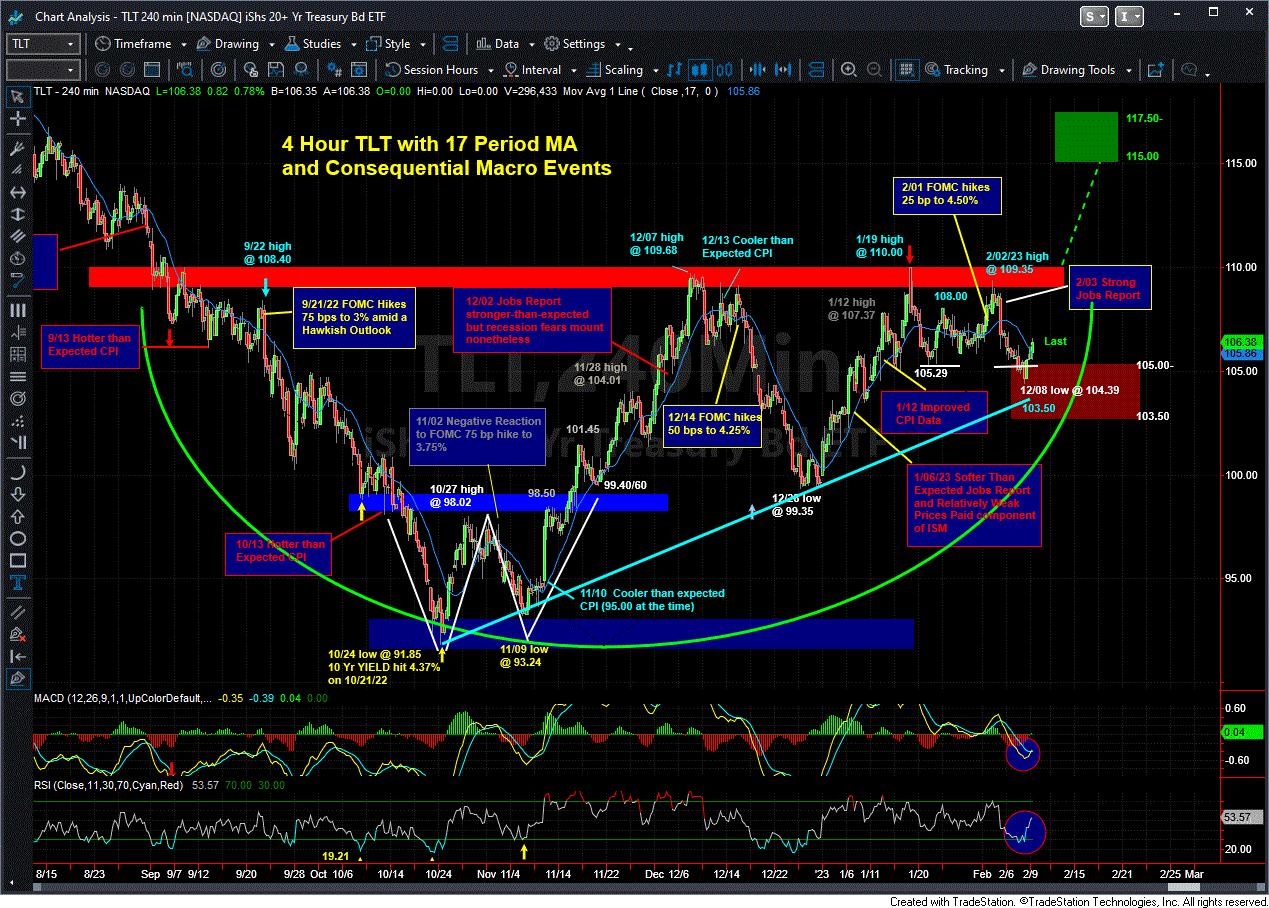
TLT (20+ Year T-bond ETF)-- For those of you positioned long the TLT (looking for lower longer-term YIELD), my attached 4-hour chart shows the recent correction from the 1/19/23 high at 110.00 to yesterday's (2/08/23) low at 104.39, followed by the upturn to 106.40/50 late yesterday into this AM. My pattern work is giving me preliminary upside reversal signals that the three week correction is exhausted, and that as long as the 104.40 to 103.50 support zone contains any renewed weakness, a new recovery upleg within the October 2022 to January 2023 advance either has started or is approaching in the hours ahead that will have as its target zone 115.00 to 117.50. Last is 106.48...
The next significant bond market catalyst arrives with next Tuesday's (2/14/23) CPI Report for January. Prepare for a "Valentine's Day" massacre of the bond and equity market bulls or bears!