Q's at All-Time High, but...
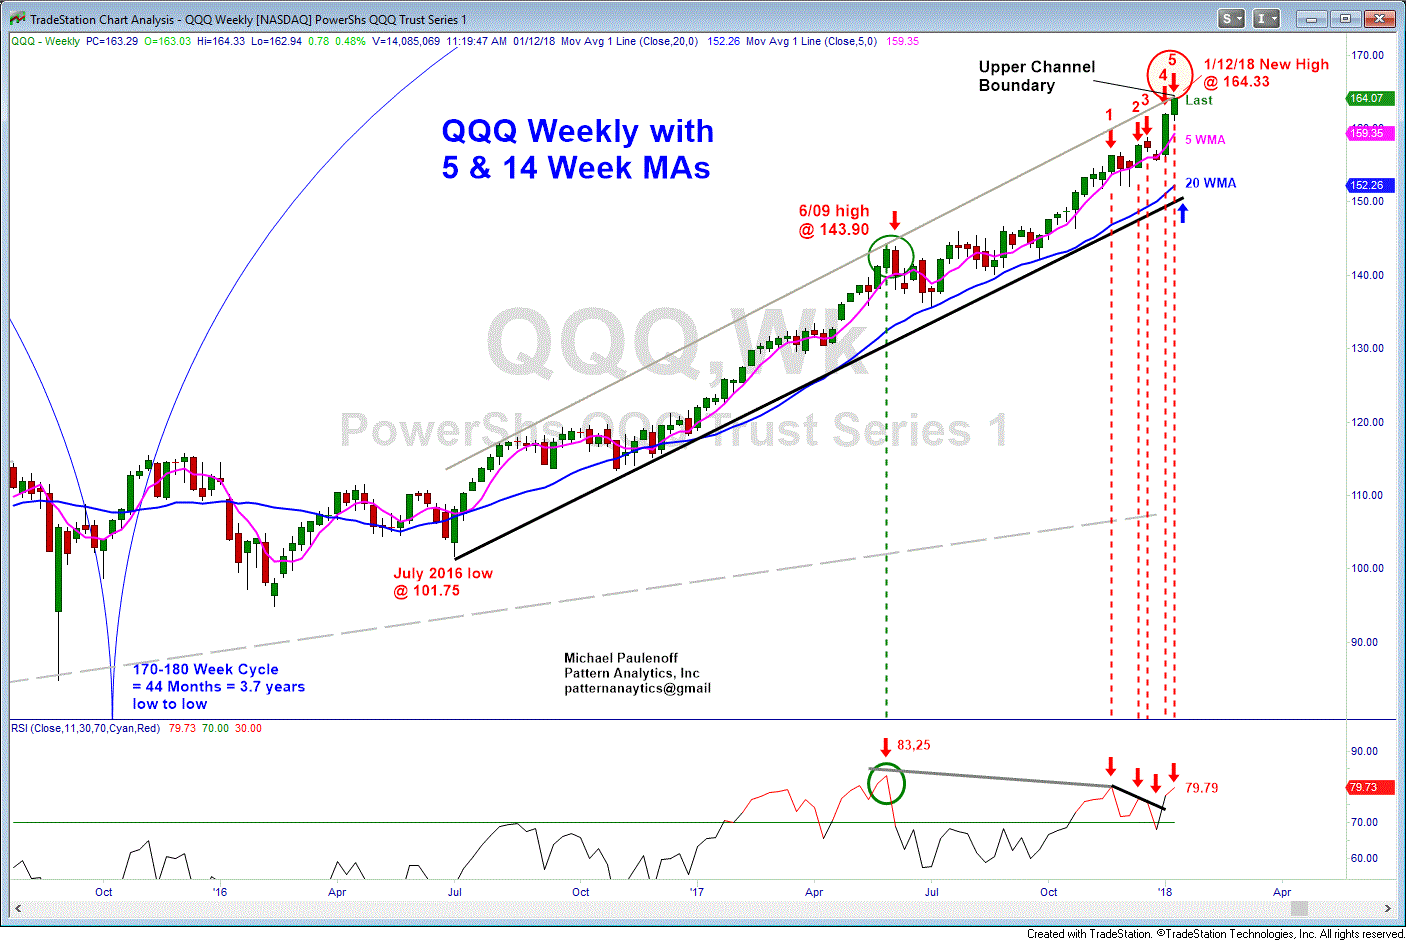
QQQ hit a new all-time high today at 164.33, which we see on the enclosed Weekly Chart, is right up against the most recent 18 month portion of its bullish price channel, and as such, is the area in and around where I am expecting a two-way market to emerge.
But who knows? This is a vertical momentum market (all of the indices), so who knows how and when a loss of steam will manifest itself? Technically, however, the last two week upmove from 156.17 to 164.33 (+5.2%) has propelled Weekly RSI to the 79-80 level, which remains shy of the June 2017 Price-RSI confirmed high at 83.25, and is a source of concern as an ongoing, intermediate term negative divergence.
So far, the divergences have not mattered much, but in that the price structure is bumping up against its upper channel boundary line, perhaps QQQ is at a very significant inflection point?

