RIVN and CVNA Chart Update after last eve's announced Rivian-Volkswagen deal
 By
Mike Paulenoff
By
Mike Paulenoff
RIVN and CVNA Chart Update after last eve's announced Rivian-Volkswagen deal...
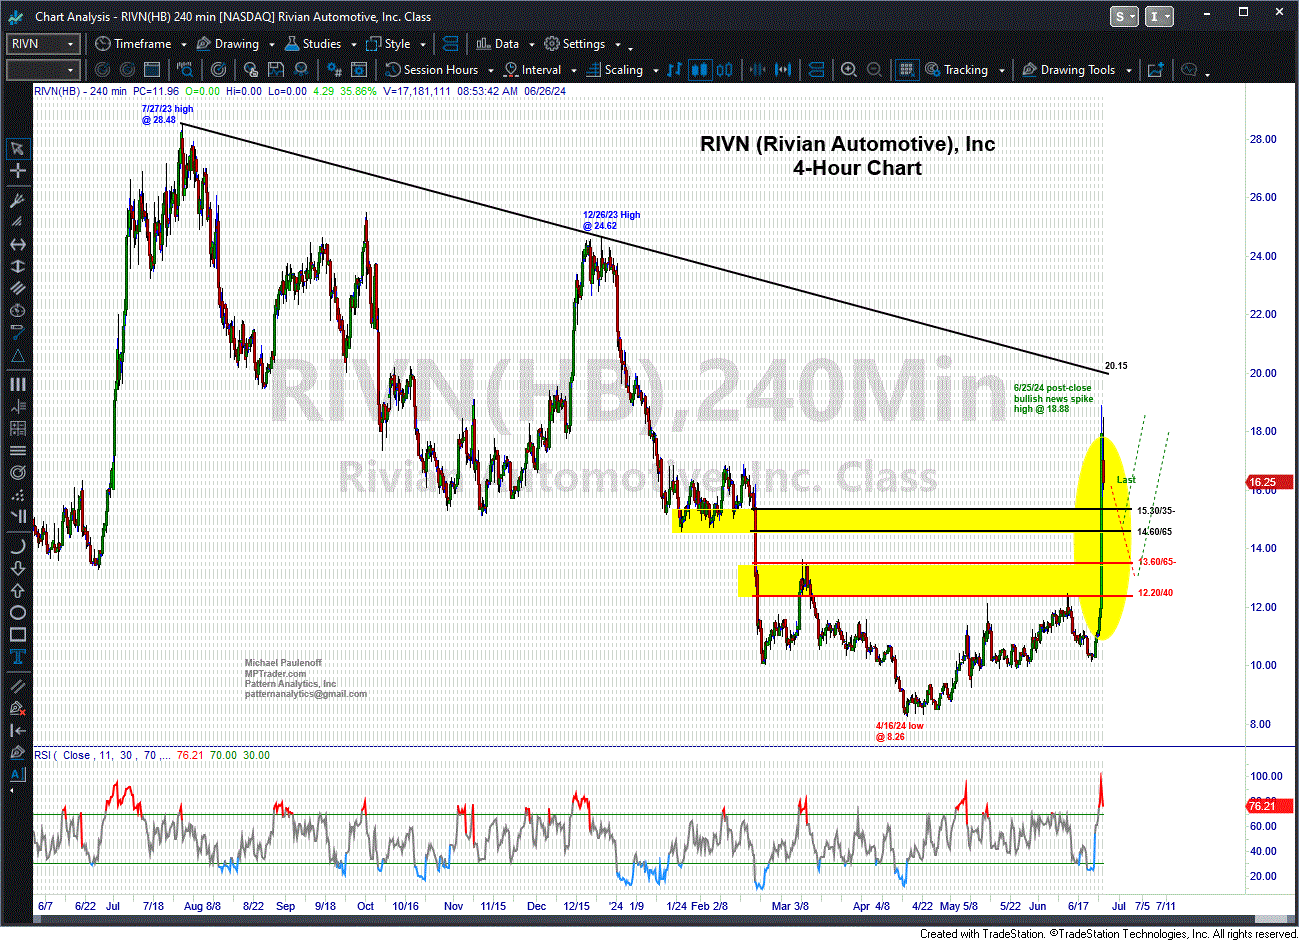
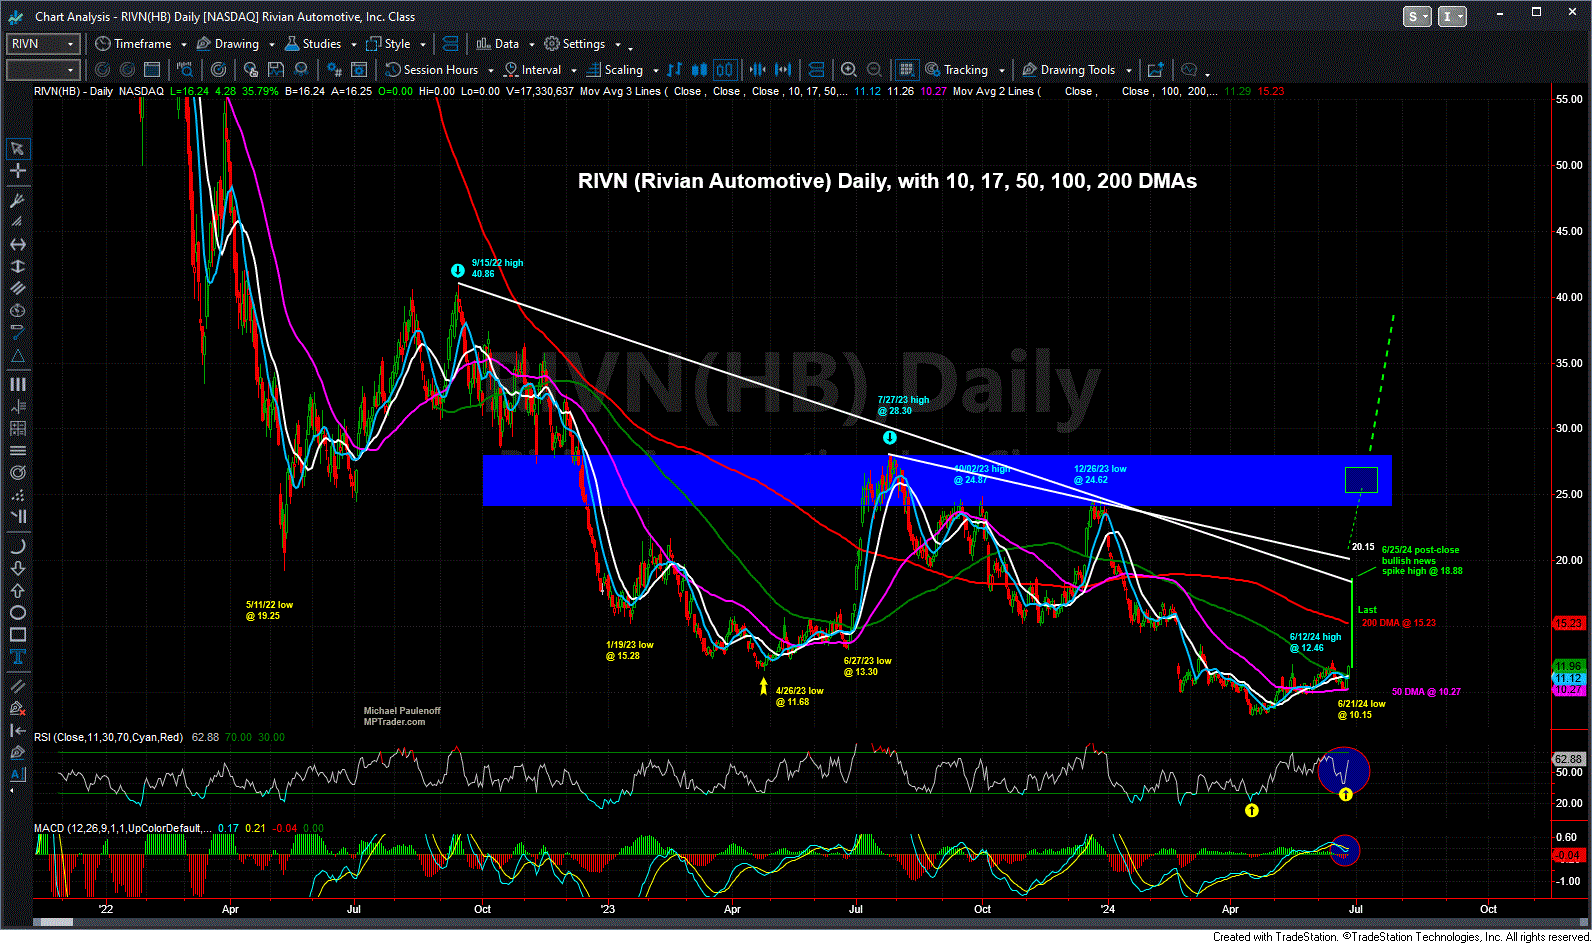
At the moment, RIVN is trading at 16.33, up 37% from yesterday's close BUT down 15% from the post-announcement spike-high at 18.88. My attached 4-Hour pattern work suggests strongly that RIVN could pull back into the 14.60-15.30 support zone prior to my expectations of another upleg that propels the stock to challenge the dominant resistance line that cuts across the price axis in the vicinity of 20.15. My attached Big Picture Daily Chart shows the current upmove that has cleared 6 months of resistance (so far) against the longer-term bearish backdrop that warns us that for RIVN to trigger a very powerful intermediate-term upside reversal signal, it needs to climb into and above massive resistance lodged between 24.50 and 28.30. My suspicion is that RIVN is entering a base-building period and pattern that will have its 200 DMA (now 15.23) as a floor and 24.50 as a ceiling for the next 1 to 3 months before a subsequent advance breaks out into an intermediate-term buy signal... Last is 16.25...
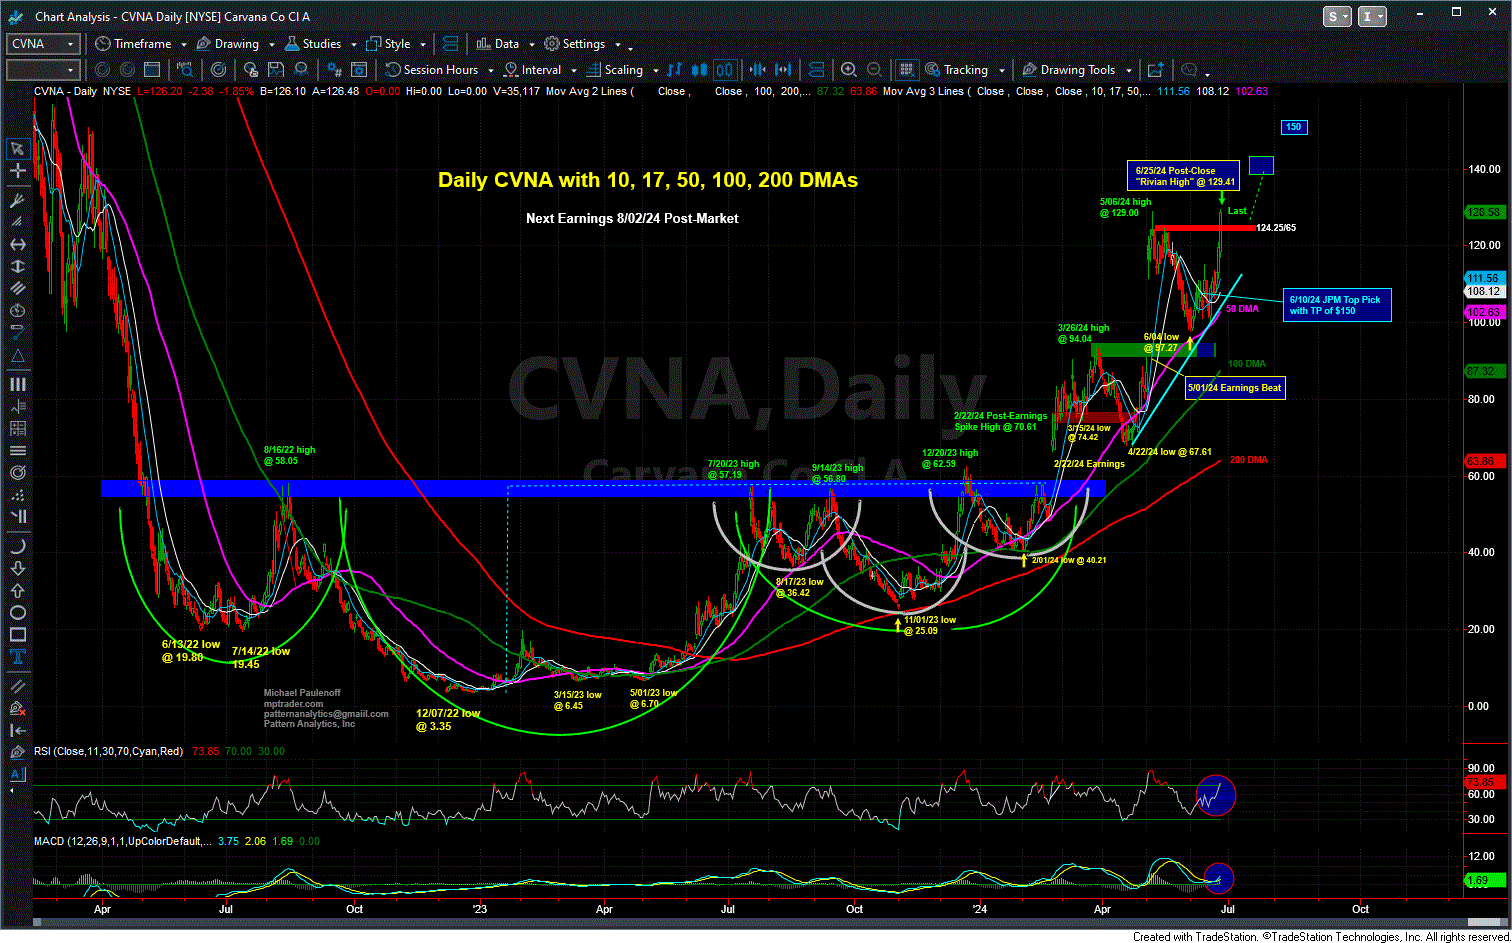
As for CVNA, it spiked higher in sympathy with RIVN, thrusting to a new bull phase high at 129.41 before settling back to 125.80-126.00 this AM. As long as any weakness in CVNA remains above 112.40/50, my pattern work argues for another upmove that heads for 138-142... Last is 125.79-126.00...