Rising Oil Putting Upward Pressure On Yield
 By
Mike Paulenoff
By
Mike Paulenoff
Good Wednesday Morning, MPTraders! September 9, 2026-- Pre-Market Update:
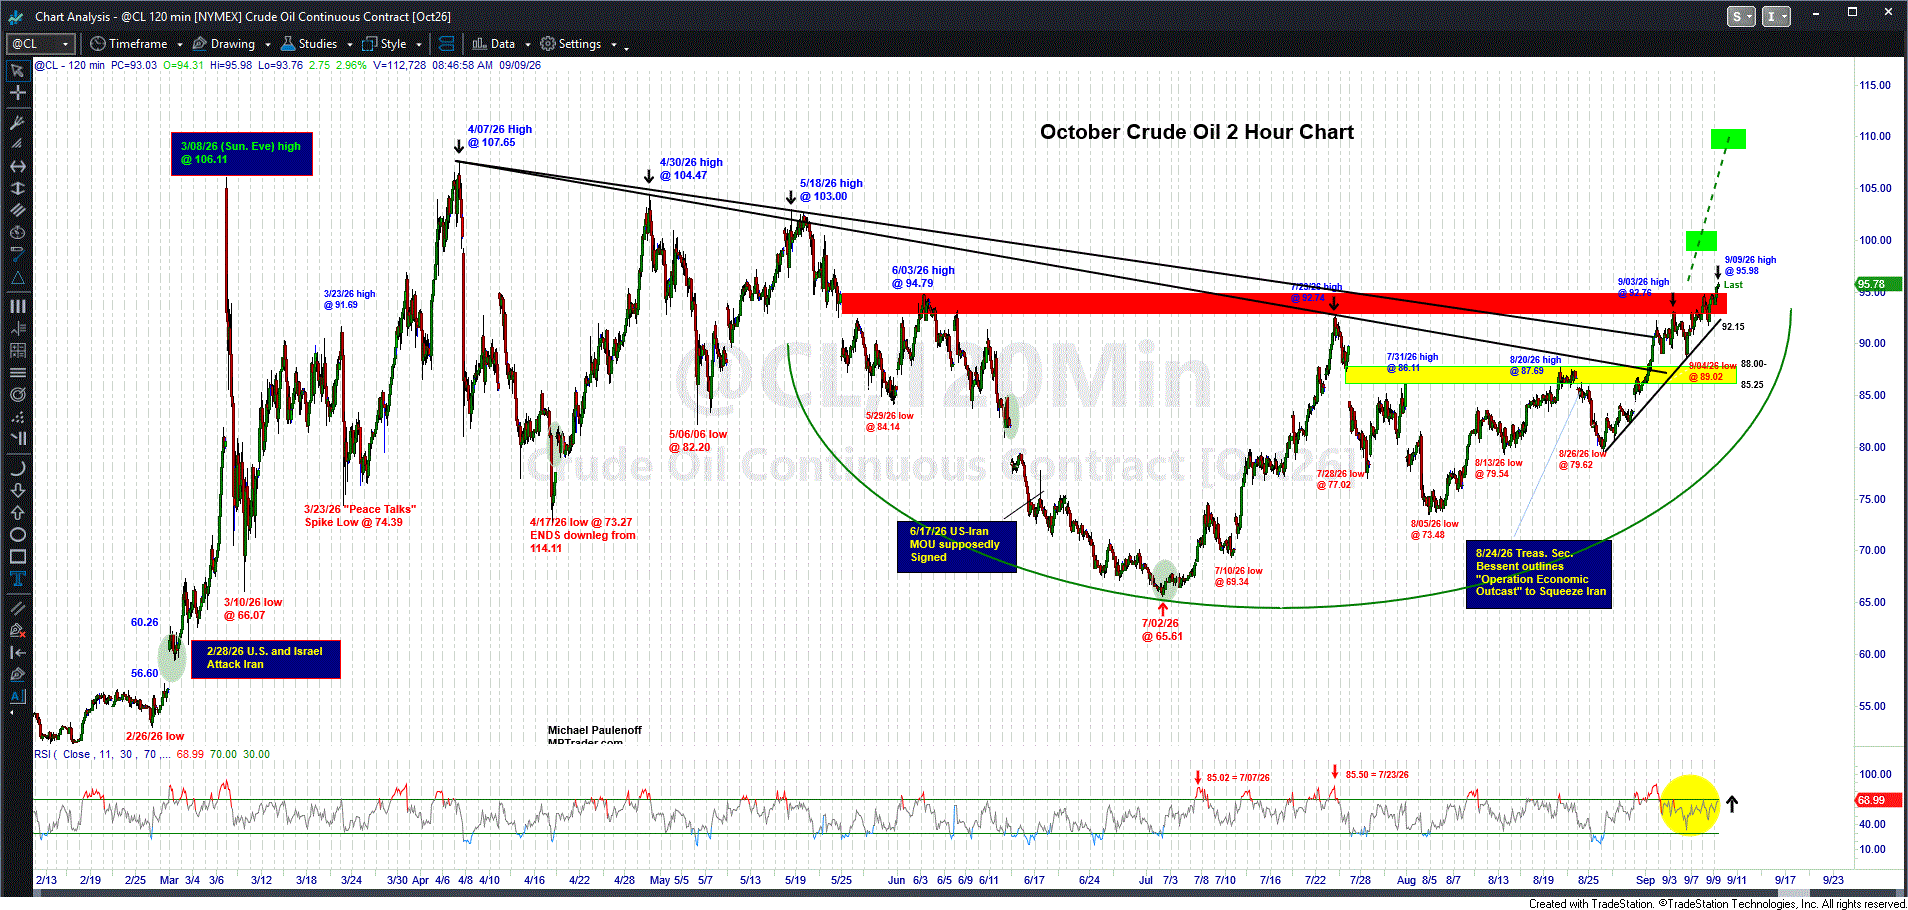
-- While we await the next round of PPI (Thursday) and CPI (Friday) Inflation Data, the elephant in the room is Crude Oil, which took out-- and is trading above-- $95.00, a key 4-month resistance plateau...
My attached 4-hour chart shows the upside breakout price action that sits atop a potentially explosive Cup and Handle or Saucer Bottom technical structure that projects a next immediate target of $100, a secondary target of $110, and a tertiary target of $118 to $122. From a near-term technical perspective, to inflict some damage to the dominant post-8/26/26 upleg ($79.62 to $95.98 so far), October Crude needs to reverse and press below $92.00 on a closing basis...
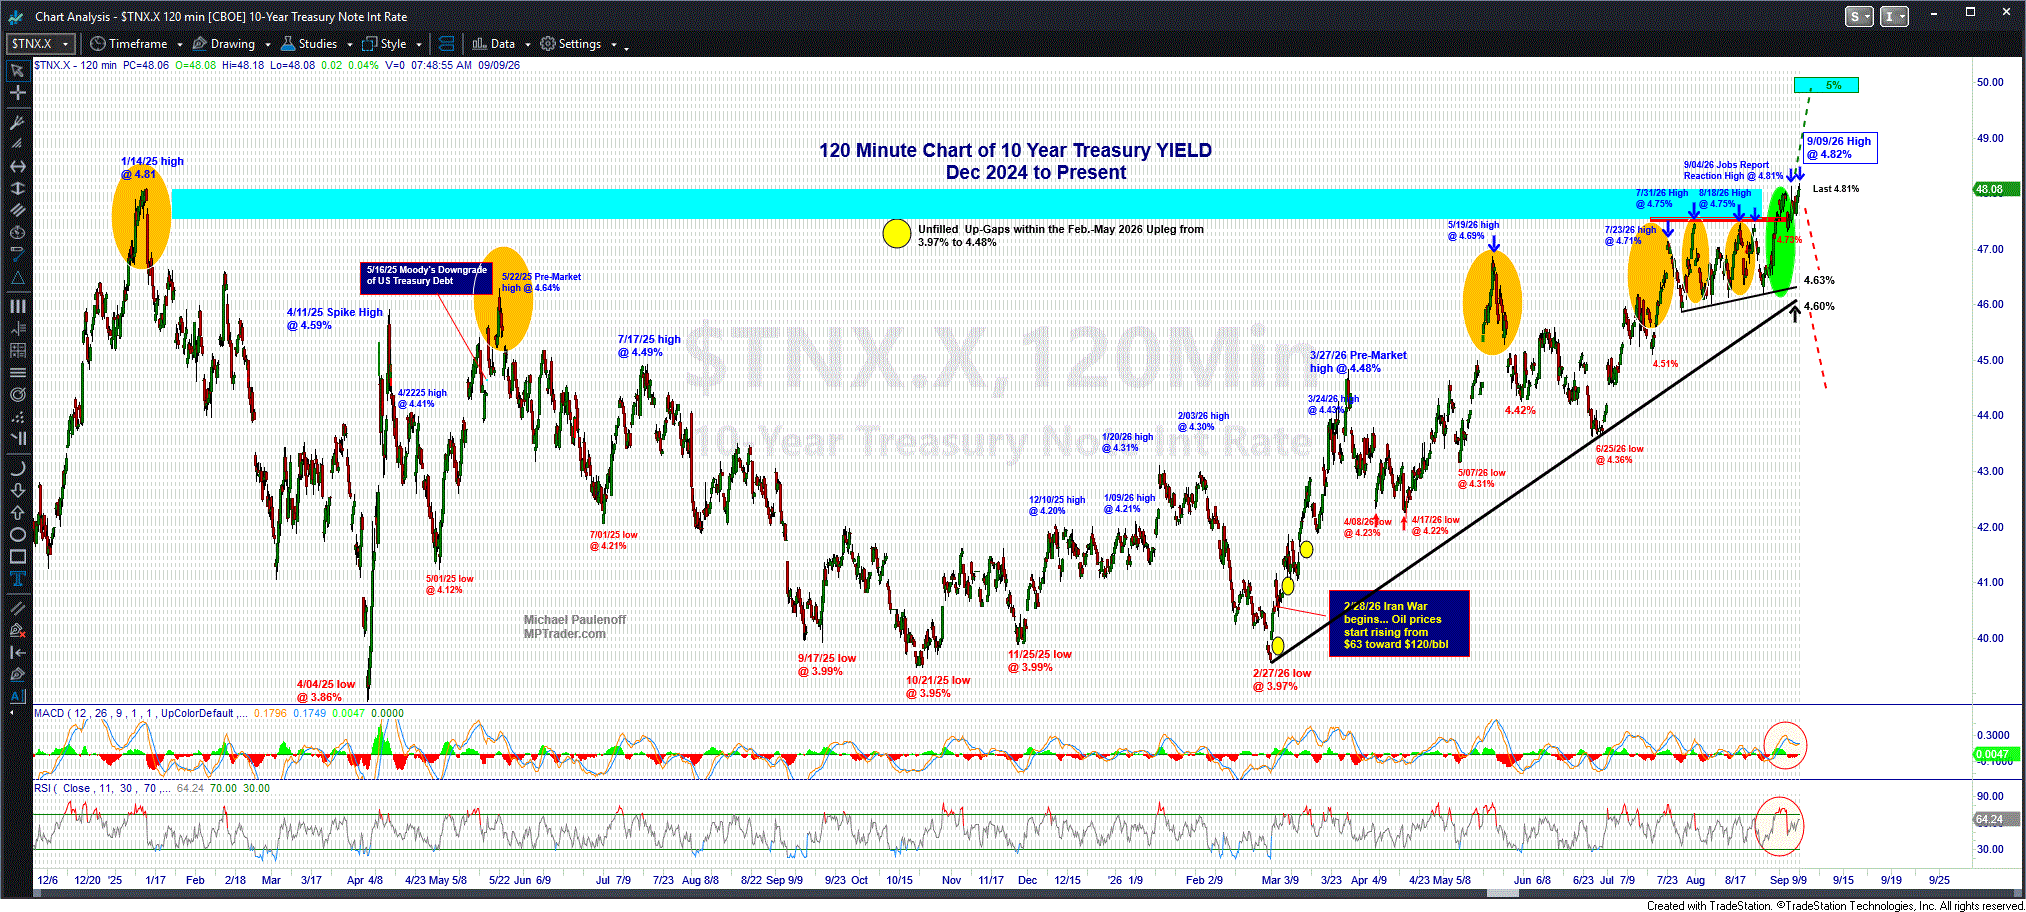
-- The rising trajectory of Oil is continuing to exert upward pressure on benchmark 10-year YIELD, which again is circling 4.80% amid a technical setup that projects still higher YIELD near-term, somewhere north of 4.85% ahead of Friday's highly anticipated Core CPI Inflation report (see my attached 2-Hour Chart). That said, supposedly Treasury Secretary Bessent will announce the size of the next buyback operation sometime TODAY, and rumor has it, that the amount will be considerably larger than the originally announced $4 Billion 10-30 year T-bonds. The internet is buzzing about a $6 -10 billion range for the next operation that begins tomorrow, which predates the Quarterly Refunding announcement in November!...
For the markets, then, the $64,000 question is whether or not the Treasury buyback program will put a lid on YIELD, which will carry over into support for the Equity Indices? If not, then the macro markets are in for a very nervous-- and likely negative-- near-term reaction to the ineffectiveness of U.S. Government intervention to cap rising YIELD while geopolitical conditions continue to underpin the rise in Oil prices (actual inflation that impacts us all daily)...
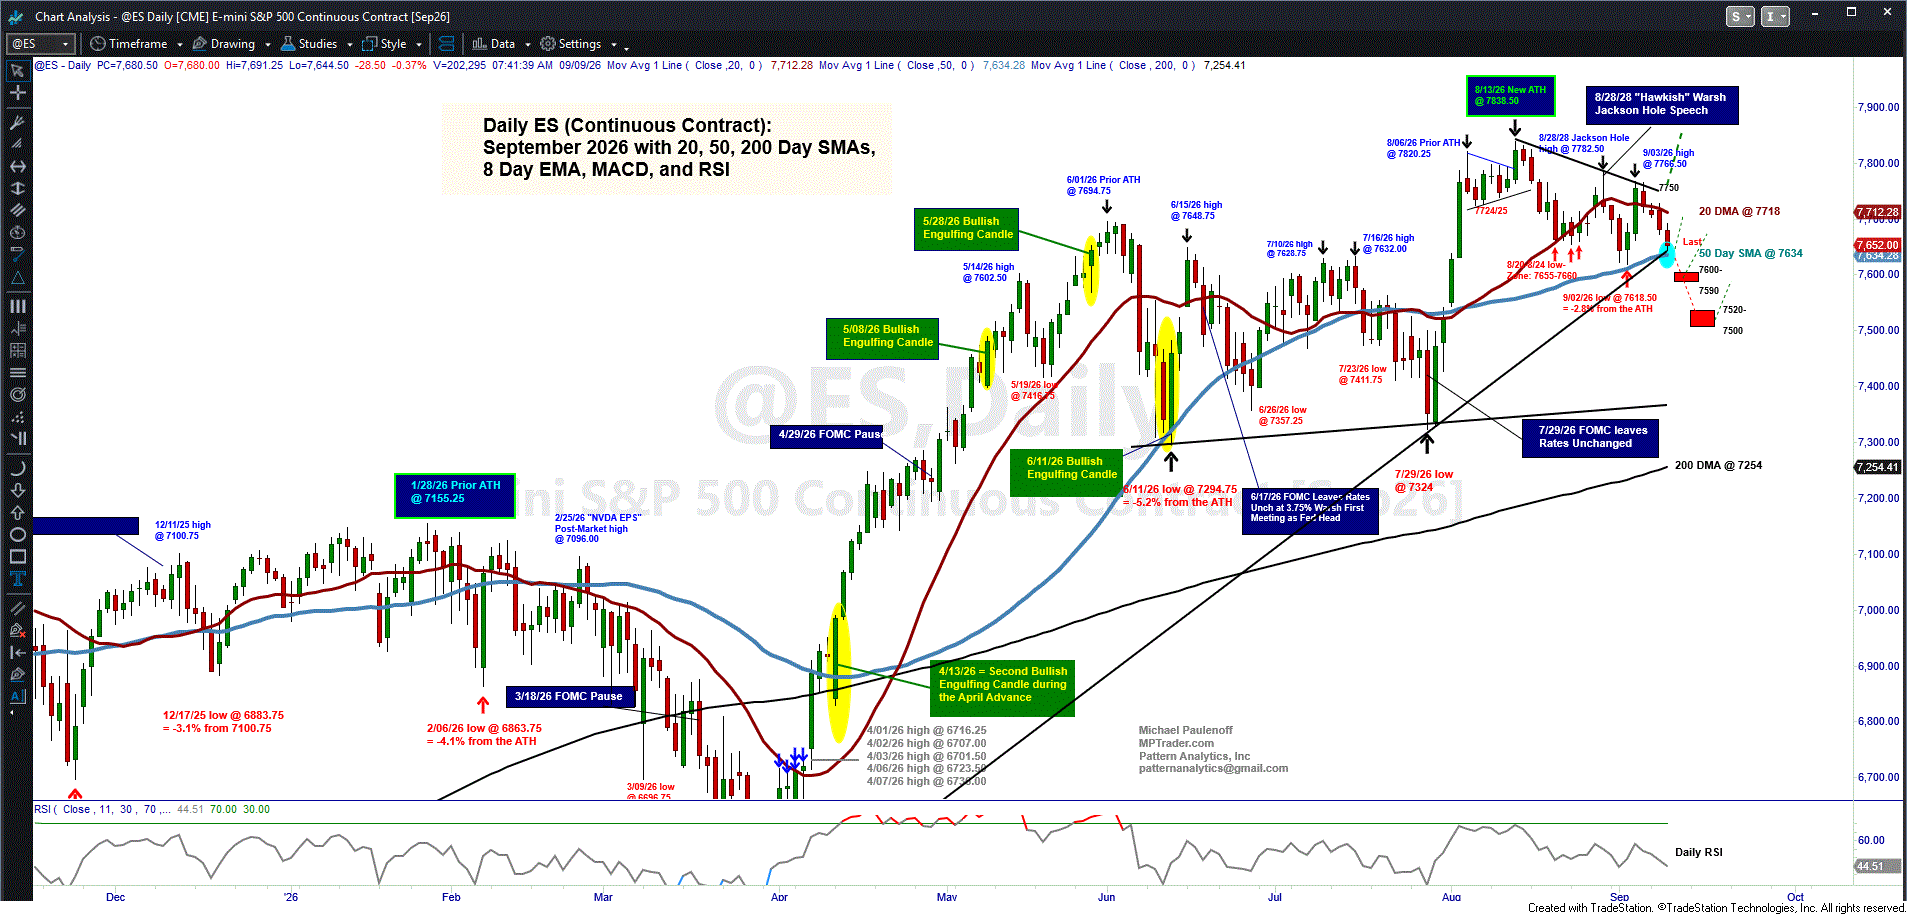
-- As for ES, it is in a challenging technical position at the moment. My attached Daily Chart shows the price structure bearing down on key support along the April-September 2026 up trendline and the 50 DMA, both in the vicinity of 7650, which, if violated and sustained, will inflict near-term technical damage to the August portion of the larger advance, triggering a lower projection to 7590-7600 initially, but if taken out, then into the 7500 to 7520 target window.
To avert entering the grasp of new downside projections, ES must EITHER hold at or above the 7650 area and recover above 7692, OR hold in and around 7590-7600 and then recover above 7650... As we speak, ES is trading at 7654...