SPX: New All-Time Highs, or Bust?
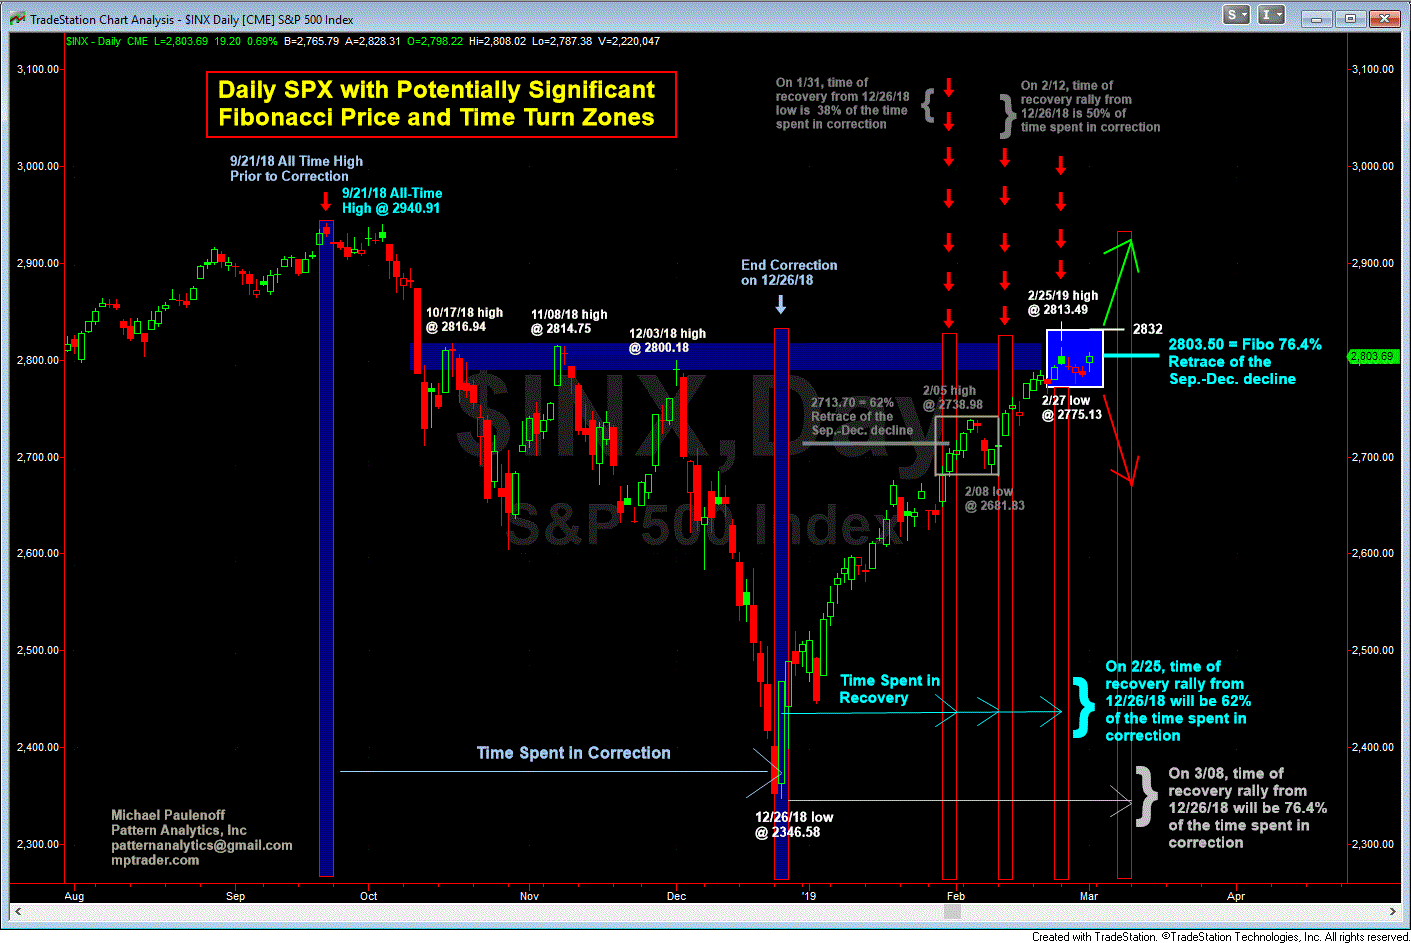
A week ago on Sunday Feb 24, prior to the re-open of electronic equity futures, the S&P 500 (SPX) stood at its Friday Feb 22 close of 2792.67, a full 19% from its Dec 26 intraday low at 2346.58. In my weekend article entitled, "Another Fibonacci Price and Time Intersection Approaches Heading into a Week Fraught with Headline Uncertainty," I discussed the importance of Mon Feb 25 and 2803.50 (+/- 1% = 2775 to 2832):
With respect to time, I noted that on Mon Feb 25, the rally from the Dec 26 low would equal 62% of the time spent in the September-December correction. As for the price of 2803.50 (+/- 1%), I noted that represented the Fibonacci 76.4% recovery of the entire September-December decline.
In terms of Fibonacci percentages, 76.4% is the reciprocal of 23.6%, and while it is no where near as important as The Golden Ratio of 62% (hurdled after Feb 8), it is nonetheless the next higher Fib retracement warning zone (2803.50 to 2832) that could present problems for this historic 9-week advance.
Before the ink was dry on my article a week ago, but as anticipated in the article, headline uncertainty invaded the otherwise quiet Sunday pre-open conditions as the wire services flashed, "Trump Delays Imposing New Tariffs on Chinese Imports."
In reaction to the actual news -- previously leaked by the Administration that POTUS likely would extend the March 1 deadline as a good faith measure because trade trade talks were progressing nicely -- futures rocketed right out of the blocks last Sunday evening, in a predictable knee-jerk reaction by the algorithmic, headline-sweeping buy programs.
Last Sunday night into Monday morning’s first two hours of trading, the Emini S&P 500 (ES) futures climbed 20 points. The cash SPX hit a new post-December recovery rally high at 2813.49 Monday morning, up 20% since Dec 26. My "Fibonacci Resistance Price and Time Intersection" amid market-moving headline uncertainty was certainly being put to the test right at the start of last week’s action.
The SPX made its high for last week and for the post-December recovery rally during the first two hours of trading on Mon Feb 25 at 2813.49. Thus, Fibonacci Time and Price remained intact as serious resistance, despite last week’s potentially impactful headlines from Fed Chairman Powell, the Michael Cohen testimony, Special Trade Representative Lighthizer’s testimony, President Trump’s summit with North Korean leader Kim, and a slew of economic data points (GDP).
What's Ahead?
Currently, ahead of Monday’s open, the SPX happens to be at 2803.69, right at the 76.4% Fib retracement resistance plateau of the entire Sep-Dec 2018 decline, while Feb 25 remains the day of the recovery rally high so far. In other words, heading into a new week of trading (starting with tonight’s ES futures re-open), my recovery rally "Fibonacci Price and Time" reversal warning zone continues to be technically relevant.
That said, however, this resistance warning zone could be put to the test right out of the blocks again tonight after President Trump’s comments in a two-hour speech Saturday (yesterday) at the CPAC Conference. Trump criticized Fed Chairman Powell as someone who "likes raising interest rates," who "loves Quantitative Tightening," and who likes a strong US Dollar. POTUS wondered out loud how much stronger the economy might be than it is already because of his policies, if only he had a cooperative Fed (my interpretation).
In the absence of any additional Trump tweets in the upcoming hours, it remains to be seen if equity futures will open higher or lower Sunday evening in reaction to POTUS’s CPAC attack on the Fed. In recent weeks, any suggestion that the Fed will refrain from raising rates has triggered knee-jerk upside market reactions since early January.
Now, however, atop a steep 20%, 10-week market advance in response to a 180-degree Fed pivot from a relatively aggressive tightening trajectory to a "data-dependent pause," the attacks on the Fed may have reached the point of diminishing returns. We could find out in the hours directly ahead, especially if my "Fibonacci Time and Price" warning window deflects the bulls assault in tonight’s action.
Meanwhile, headline uncertainty will remain acute this coming week, with possible tweets, interviews, and news stories about China trade progress and innuendos from China President Xi emanating from China’s National People’s Congress. Add to that media surrounding the potential release of The Mueller Report, earnings reports from some high profile retailers, and The February Employment (Friday morning). Yes, this week will be a minefield of potential market-moving news that could continually put my Fibonacci Time and Price Warning Window to the test.
Let’s keep in mind that last week’s SPX range was 2775.00 to 2813.49. As long as the index remains between (or below) 2775 and 2832 on a closing basis, my Fibonacci reversal warning window will continue flashing its amber lights.
Finally, in the event SPX surges and closes above 2832, then my current warning window will be invalidated, with the next set of Fibonacci price and time warning parameters (i.e., for a potential price peak and downside reversal) projected to be March 8 and 2910-2970. At that point, the time spent in recovery will equal 76.4% of the time spent in the Sep-Dec correction.
In other words, if SPX closes above 2832, then the next upside price projection will point to a run towards the all-time high at 2940.91, with an optimal target of 2910 and a maximum target of 2970.
Indeed, this should be a fascinating and consequential week for the SPX.

