SPY and IWM Exhibit Divergent Patterns

SPY and IWM exhibit a glaring pattern divergence, with SPY looking like it is about to thrust to the upside, while IWM is heading due South. More importantly perhaps is that IWM exhibits a 6 week rounded top formation to go along with the pattern divergence, which is no small matter, especially if it breaks 165.00, its 2018 up trendline. SPY needs to remain above 290 to avert potential technical damage... Last is 291.92 SPY and 16.82 IWM...

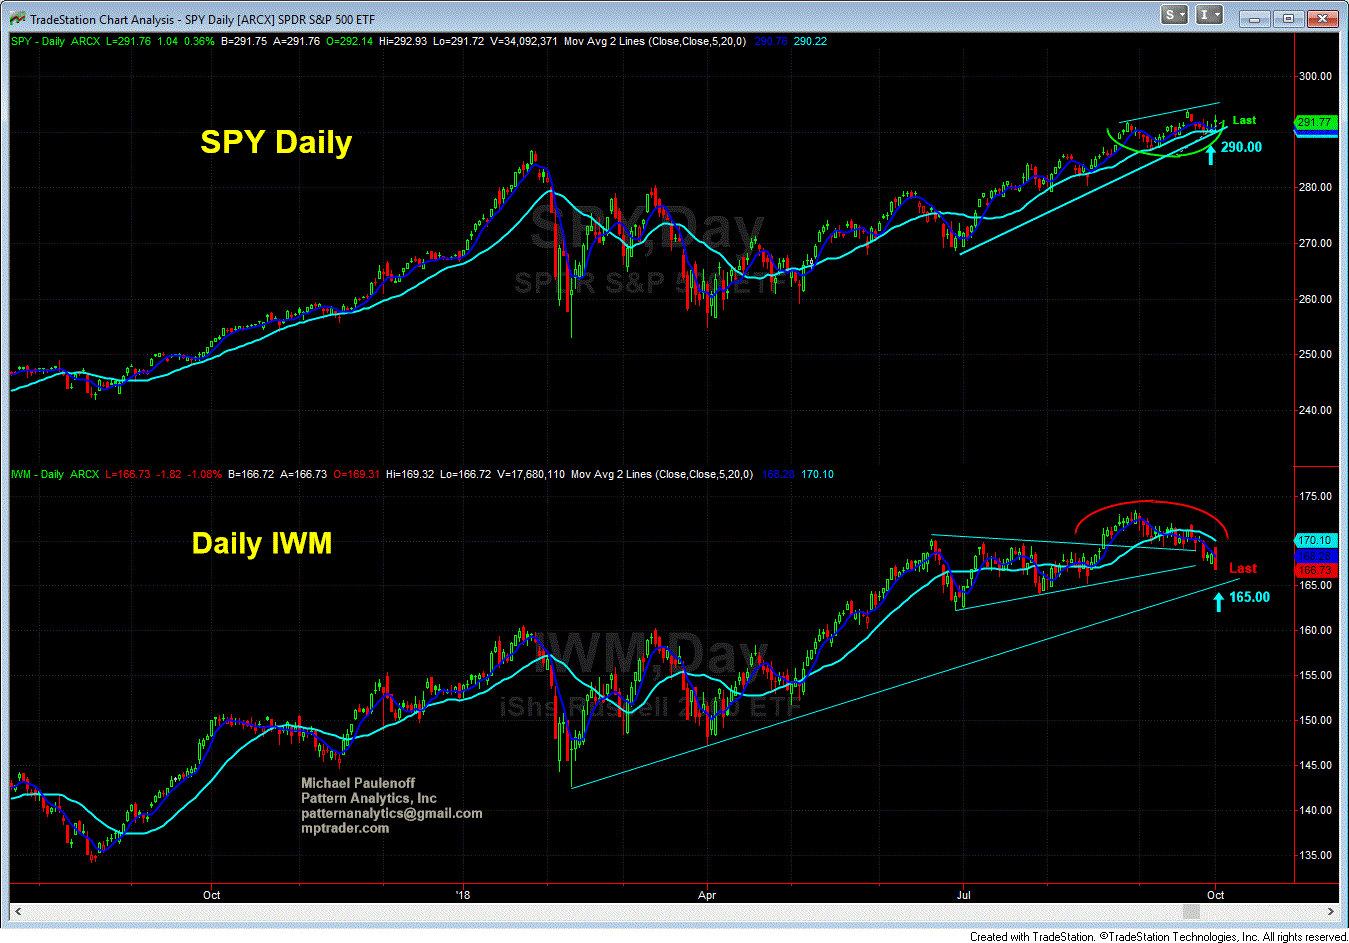
10 01 18 SPY & IWM Comparison Chart GIF

  Matched
x
  • Action-Oriented Trade Set-Ups in Stocks & ETFs
  • Macro Analysis of the Broader Markets
  • Detailed Technical Guidance for each Trading Idea
  • Live Interaction w/ Mike & Our Member Community
  • And Much, Much More!
Join Now! - Special Offer!
Veteran Wall Street analyst and financial author, Mike provides detailed and timely analysis and trade set-ups on a range of markets. Read more...

Have Mike's “Out Front” morning analysis delivered FREE to your email inbox twice weekly!