SPY in "Contracting" Pattern
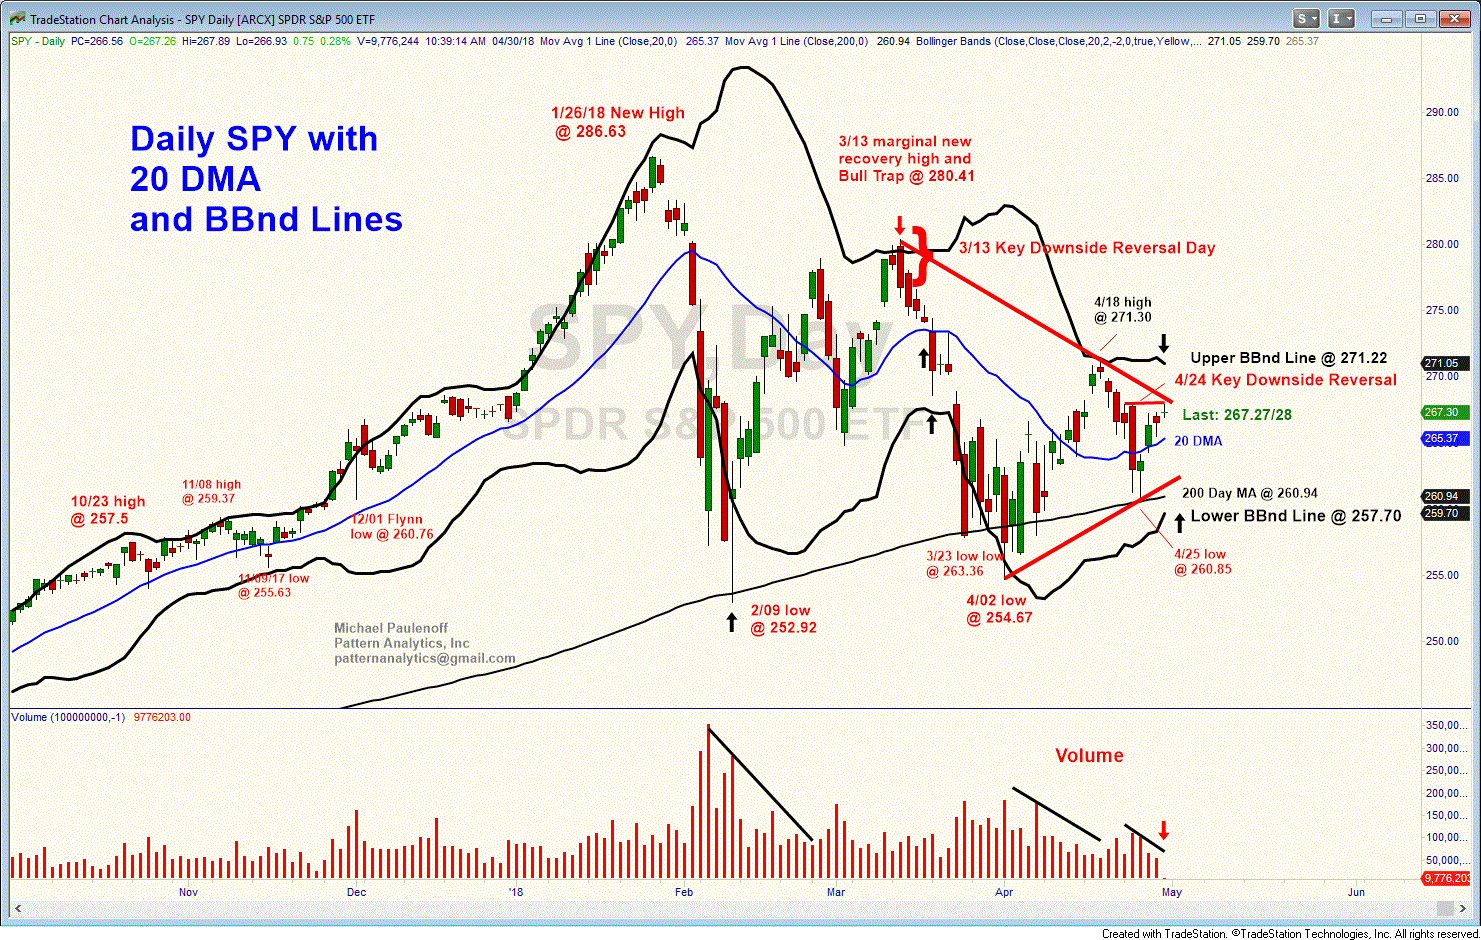
The BIG picture SPY chart, overlaid with the BBnds shows the contracting pattern that has SPY in its grasp since the 1/26/18 all-time high at 286.63.
From a nearest term perspective, key resistance hovers around 268.50, which if taken out, should trigger upside continuation towards a test of the Upper BBnd, now at 271.10.
In the absence of a climb above 268.50, SPY has nearest term support at its up-sloping 20 DMA, now at 265.40/50, which if violated, will point to another press to test the vicinity of the 262-261 support zone, which includes both the Apr. up trendline and the 200 DMA.
Perhaps the most glaring technical aspect of the BIG Picture chart besides the three month sideways pattern is steadily diminishing volume. In fact, current volume is competing with the Christmas holiday period for the slowest and lowest of the year, which is VERY unusual for April.
I am not sure what it means, except that less participation leaves the indices more at the mercy of the big program traders, algos, and manipulators, which is never a good thing (for the rest of us)... MJP

