Selloff in NVDA On META News, Plus Yield Poised To Test Support
 By
Mike Paulenoff
By
Mike Paulenoff
Good Tuesday Morning, MPTraders! November 25, 2025-- Pre-Market Update:
-- News emerged in the wee hours this AM that Mark Zuckerberg (META) purportedly is negotiating to buy Google Chips (TPUs) instead of NVDA chips, which has triggered algorithmic selling in NVDA (-4%) in pre-market trading. My attached 4-Hour Chart shows NVDA weakness is pressing toward a full-fledged retest of last Friday's pre-market spike low at 172.93-- if violated and sustained on a closing basis, will project downside continuation toward 164-167 next... Last in pre-market is 174.49...
-- A slew of old economic data was released this AM, showing a relatively weak labor market (ADP), weaker than expected Retail Sales, and stalled inflationary pressures that have pressured 10-year YIELD toward 4% again as November comes to a close in 2-1/2 trading days (continued below the data table)...
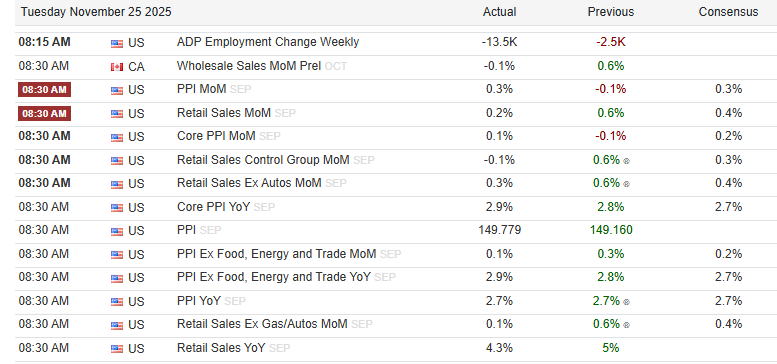
My attached Monthly Chart of benchmark 10-year YIELD shows the YIELD structure is pointed lower and accompanied by negative and nosediving monthly Momentum gauges, all of which suggest strongly that YIELD is poised for a test of key support lodged between 3.90% and 4.00%, which under-shoot to 3.70% to test the dominant up trendline from the March 2020 Pandemic lows... (Continued below my YIELD chart)...
As for ES, since last Friday's upside reversal, we have overtures about a rate cut pivot from the Fed Heads, we have powerfully positive seasonal tailwinds, a potential Ukraine-Russia peace deal (increased geopolitical stability), overlayed on a reluctant risk-on investment landscape (underwhelming market sentiment), all of which provides a bullish background for the equity markets into year end...
To that end, my attached Hourly ES Chart shows the index stalling atop its Friday-Monday upleg from 6525 to 6732.50 (+3.2%) as it bumps up against a two-week resistance line.
In that I can make a compelling argument that the upleg exhibits bullish form, the setup indicates that weakness-- should any unfold in the upcoming hours-- is a buying opportunity ahead of another upleg. Nearest support resides from 6700 down to 6675, with downside extension into the 6645/55 support plateau from where the next upleg should emerge... Last is 6715...