Small Caps (IWM) Take The Brunt Of Sell-Off
IWM (Russell 2000 Small Cap ETF)-- Yes, the implication that the Fed will hold rates higher for longer, or the number of potential rate cuts is less than previously expected, or the higher for longer situation will produce a recession (finally), are negatives for the Small Caps, which are down 3.2% today compared to -1.2% for SPY and -1% for the QQQ.
That said, however, the weakness has not inflicted trend-changing "pattern damage" to the near and intermediate-term setups in the IWM-- at least not yet.
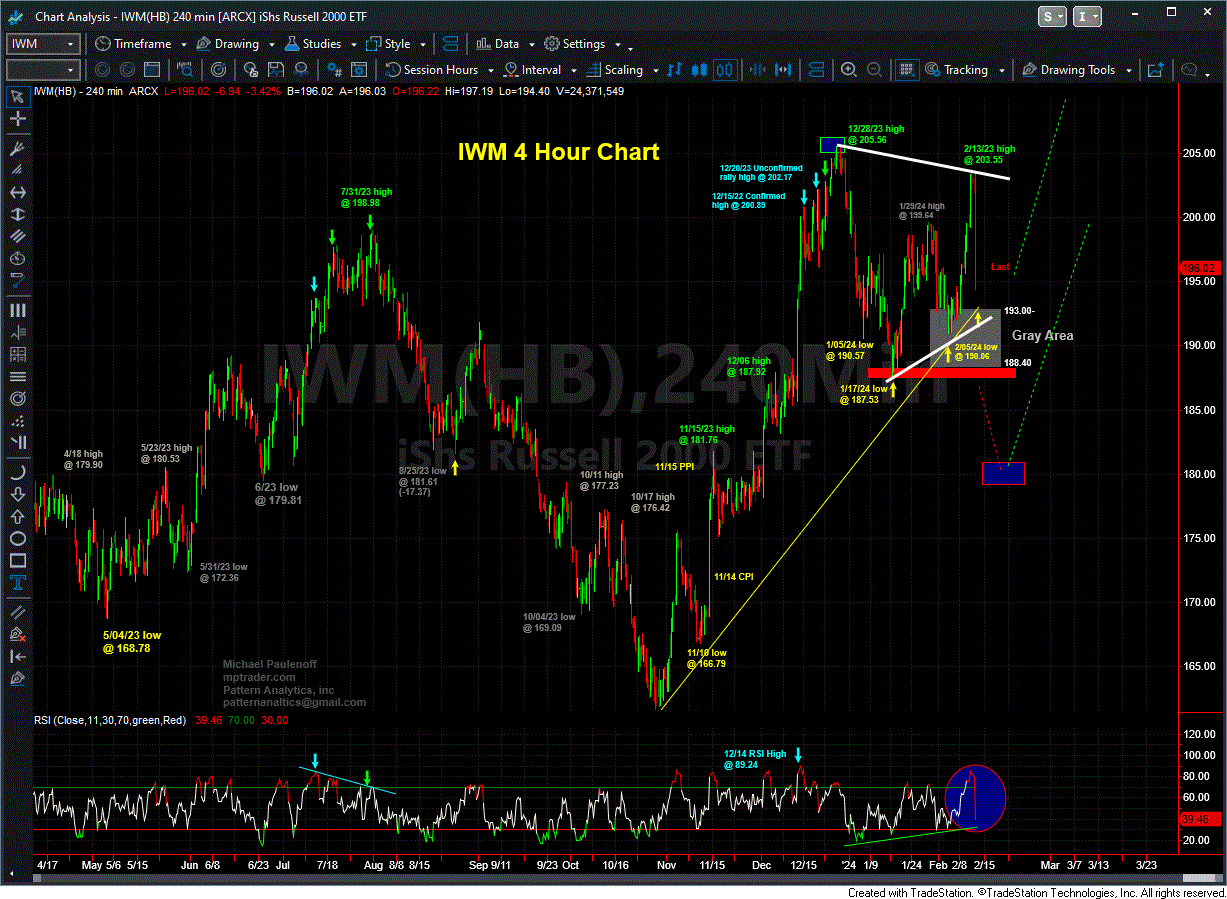
Today's weakness from the perspective of my 4-Hour setup has morphed what appeared yesterday as a budding new upleg off of the 2/05/24 pivot low at 190.06 into a larger-developing sideways Coil type of structure from the 12/28/23 high at 205.56. In other words, the correction that started at the Dec. 2023 high of 205.56 is NOT yet complete and needs EITHER more time to digest the Oct-Dec advance by ping-ponging between the contracting white lines on my chart, OR-- if the 190.06 nearest term low is violated-- needs a deeper correction that will have potential to break the 1/17/24 low at 187.53 in route to 180-182 prior to embarking on a new, powerful upleg.
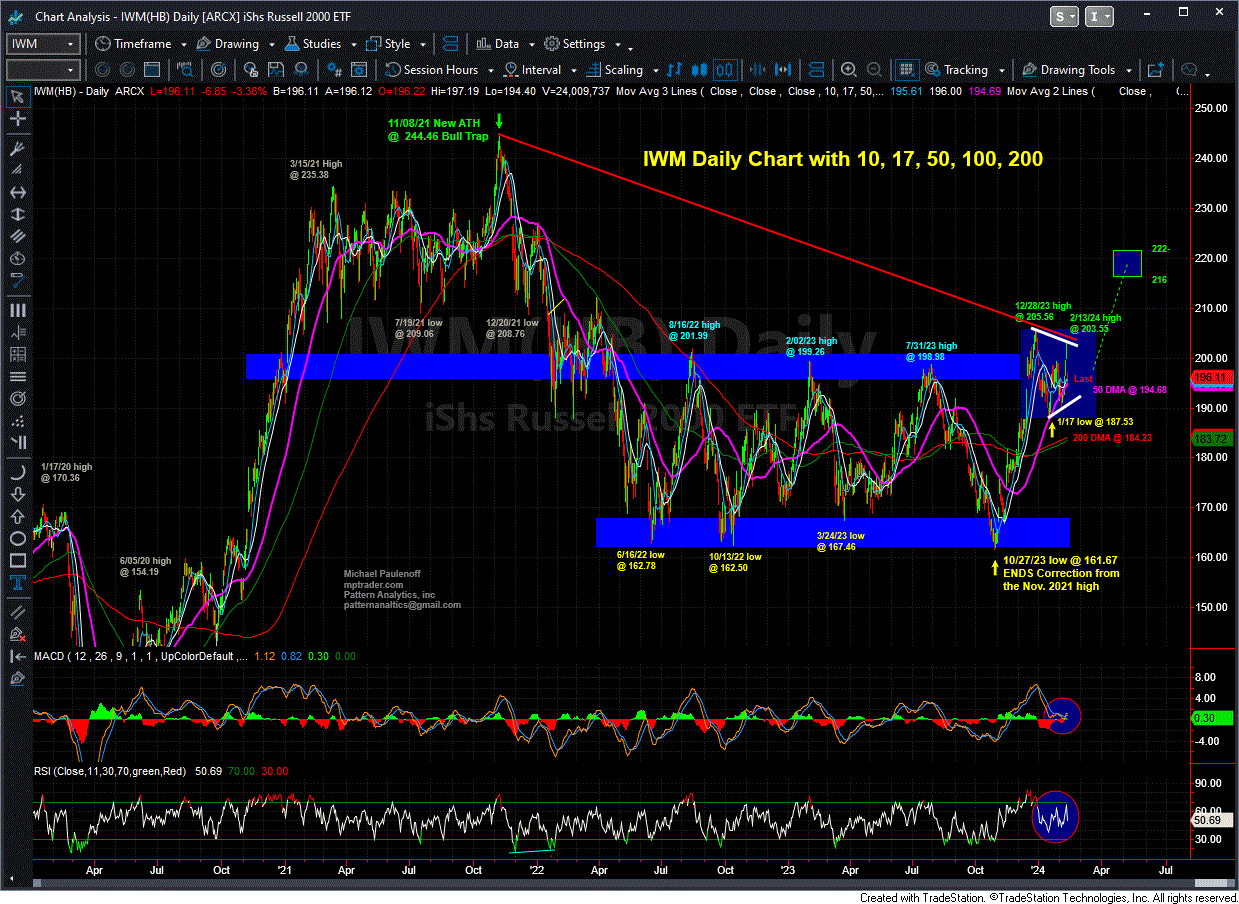
My BIG Picture Daily Chart shows the white-lined contracting Coil pattern after yest's IWM upmove smacked into, repelled, and reversed the dominant Nov. 2021-Feb. 2024 resistance line at 203.55, thereby eliminating the "new bull leg" scenario in favor of more corrective work. Today's weakness to an intraday low of 194.40 so far has tested and so far held above the sharply up-sloping 50 DMA, now at 194.70. A close today ABOVE the 50 DMA will be considered a very positive technical "event." Conversely, a close beneath the 50 DMA will be considered a signal that more weakness is ahead that will point toward a test of lower boundary line of the Coil, in the vicinity of 191.50.
Bottom Line for IWM: This weakness has invalidated the most bullish Scenario #1 that a new upleg was in progress off of the 2/05/24 low at 190.06, and morphed the pattern setup into Scenario #2 calling for more rangebound price work above 190.06. which must contain any further acute weakness to avert morphing the pattern in Scenario #3-- a potentially much deeper retracement of the Oct-Dec advance... Last is 196.80


