TSLA Thrusts Above Resistance
 By
Mike Paulenoff
By
Mike Paulenoff
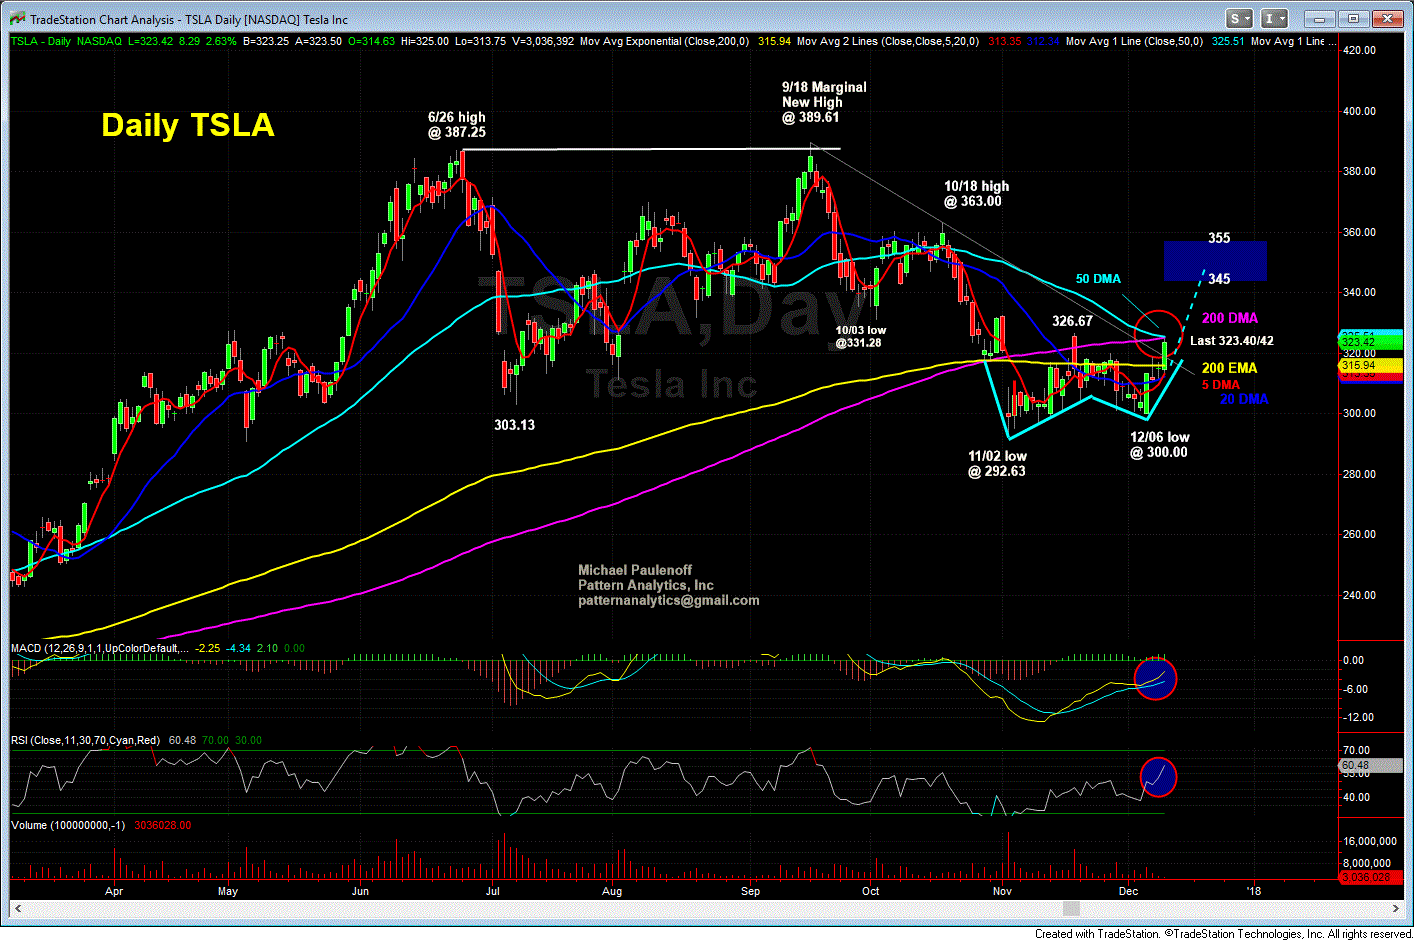
TSLA (finally) has surged about $8.50 this morning, thrusting above key resistance lodged in and around 314-316, which we notice also represents the convergence of the up-sloping 5 and 20 DMA's, as well as the horizontal 200 Day Exponential MA. The thrust has propelled the price structure towards a challenge of the convergent up-sloping 200 (simple) DMA and the down-sloping 50 DMA, now at 325.50, which if (when) hurdled, will trigger a higher target zone at 345-355.
If we take a step back from the big picture chart, a technical case be made that TSLA has completed the Nov.-Dec. bottoming process in the aftermath of a June-Nov/Dec. corrective period from 387-390 high to 292-300 low, with the correction itself taking the form of a Double Bottom (292.63-300.00). As long as TSLA remains above 314-316 support on a closing basis, my preferred scenario points to 345-355 before year end.