
TSLA Thrusts Towards a Test of Its All-time High
 By
Mike Paulenoff
By
Mike Paulenoff
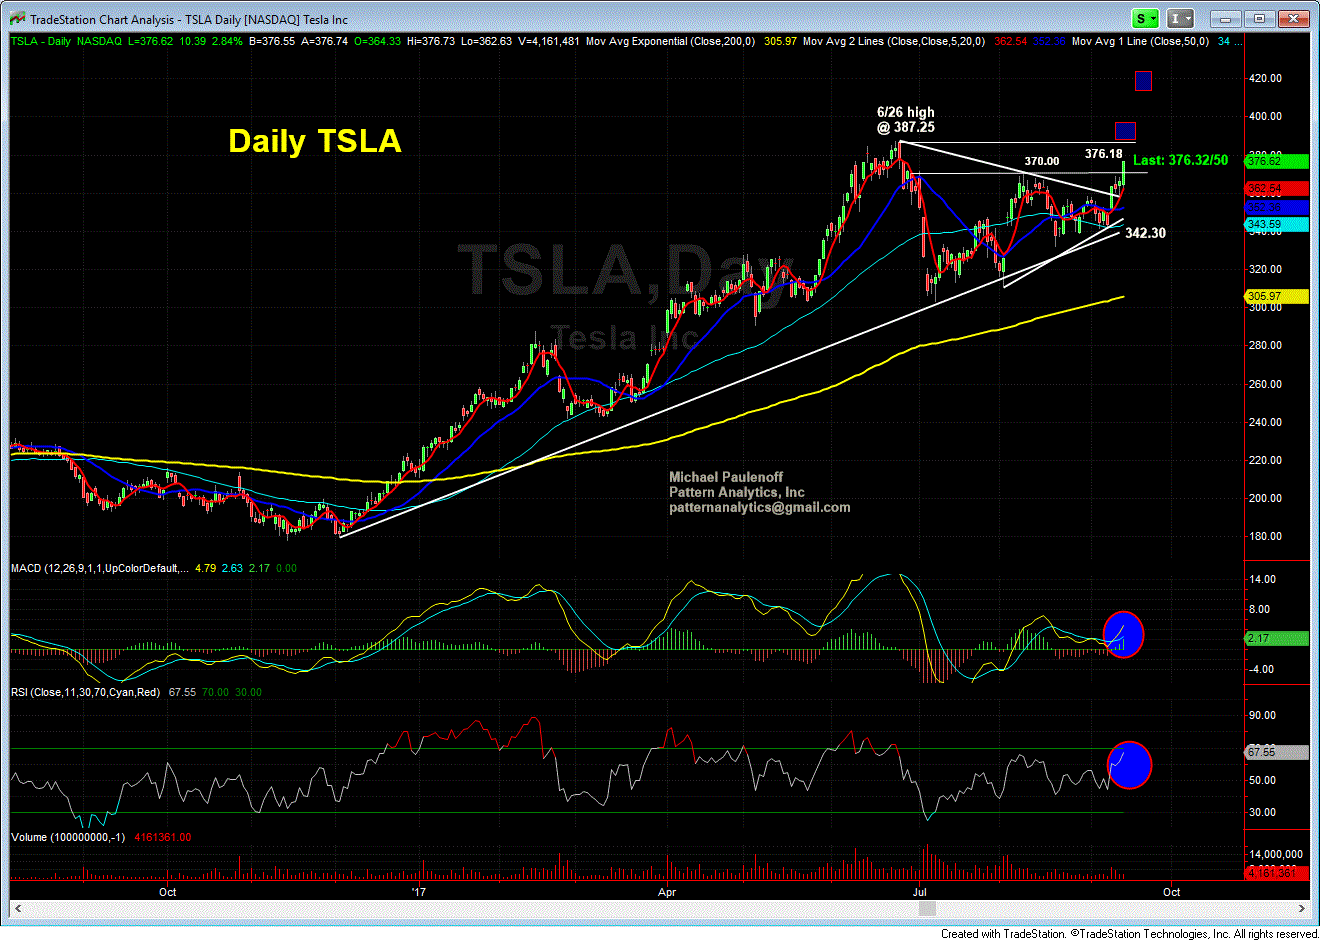
TSLA-- Our Model Portfolio is long at 358.40 from 9/11/17. The attached daily chart shows why we entered longs: because my set up and pattern work argued strongly that the June - Sep. high level bullish digestion period was ending, and from it a powerful thrust should emerge that propels TSLA to revisit the June high at 387.25, and thereafter, into new high territory projected into the 420 area.
The upside breakout occurred on 9/11, and the close that day at the high (363.69) triggered the initial signal that TSLA's next upmove was in progress. Today's upmove has taken out the prior rally peak at 370.00 from 8/09. A close above 370.00 will provide additional technical evidence that TSLA is in route to 385-387 next.
9 14 17 TSLA day 1 PM GIF