Technical Weakness Ahead for YIELD
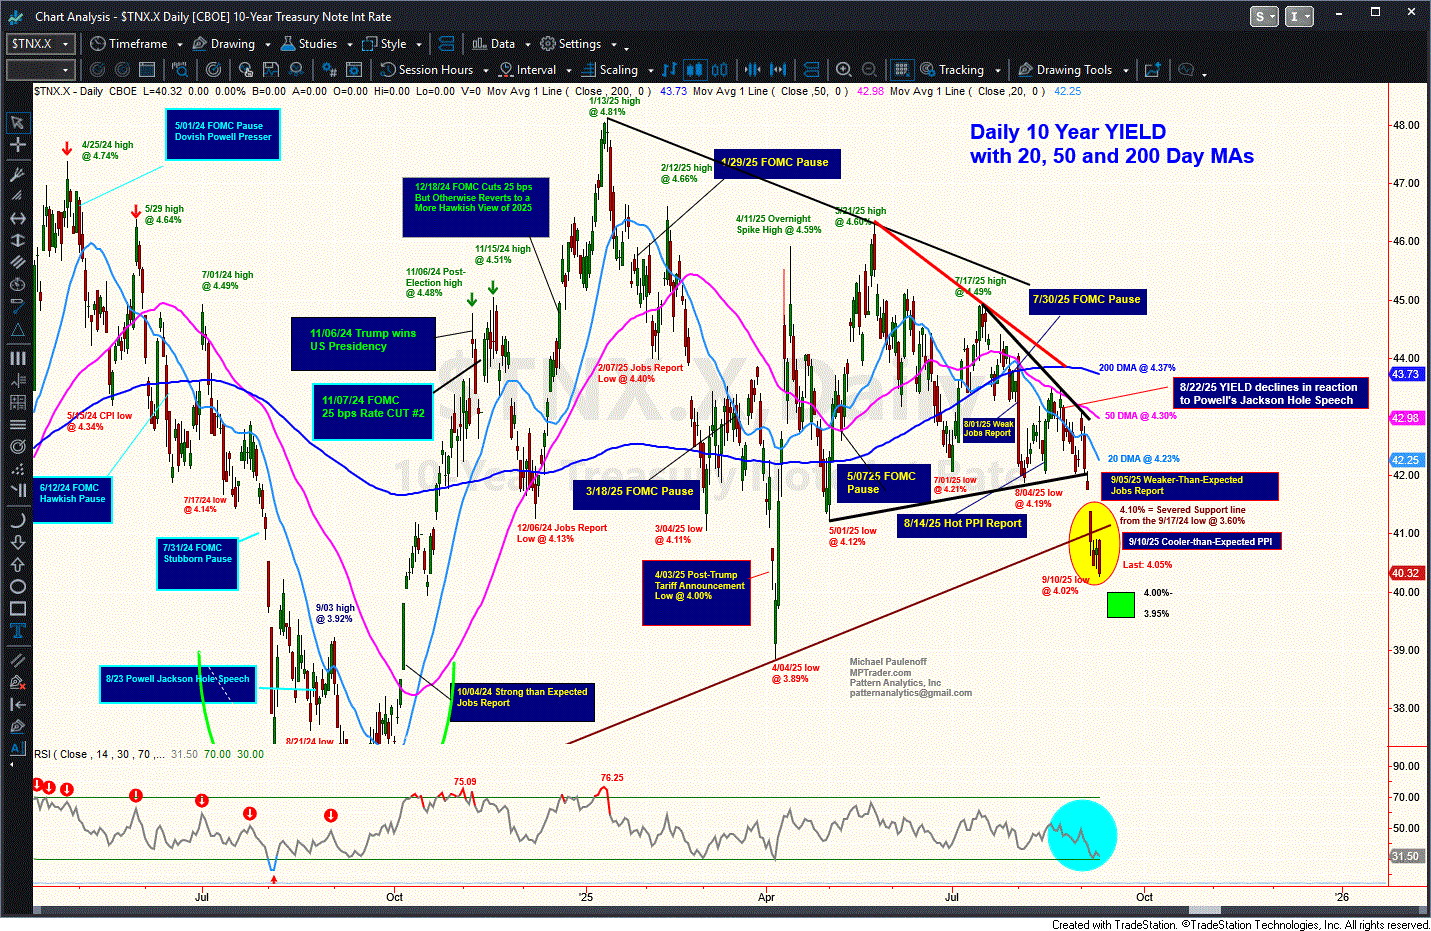
Benchmark 10-year YIELD is circling 4.05% ahead of this morning's CPI data. We see on my Daily Chart of 10-year YIELD, that yesterday's downside YIELD reaction to cooler-than-expected PPI data has the right look of a Bearish Engulfing Candle that indicates technical weakness ahead. As long as any upmove in YIELD is contained beneath nearest resistance at 4.09% to 4.11% on a closing basis, YIELD points to a test of the psychologically important "Big Figure" level of 4.00% (down to 3.95), which if violated on a closing basis will put 3.70% on the table for 10-year YIELD.
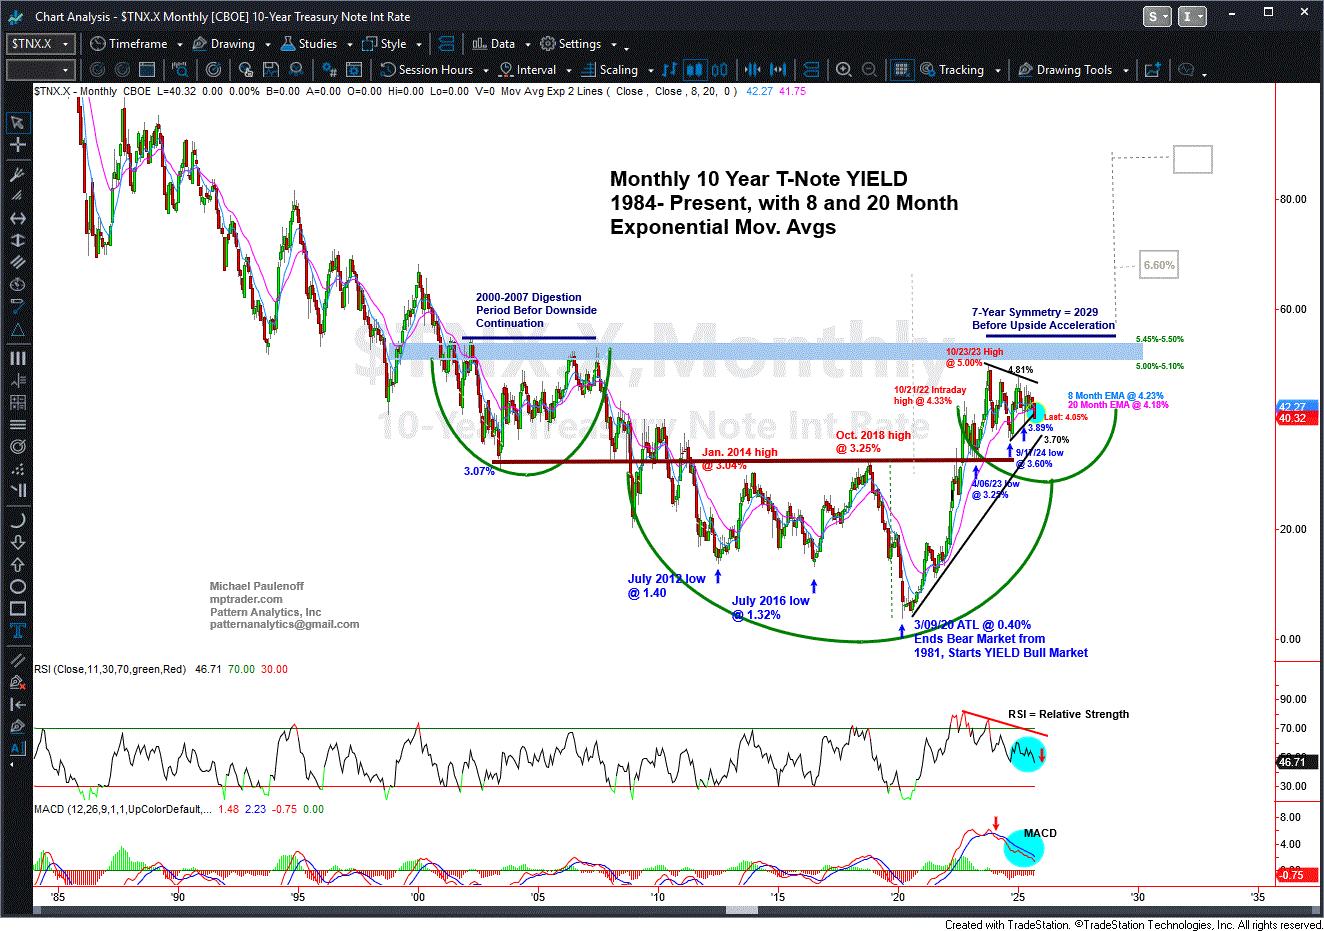
 From the perspective of my attached VERY BIG PICTURE Monthly Chart, which is down from the August monthly close of 4.23% to yesterday's low at 4.03% (so far), the technical YIELD and Momentum setup presents a near-term (1 to 3 months) vulnerability to YIELD weakness that projects to 3.60%-3.70%. This is within a larger-developing multi-year "Right Shoulder" of a post-2000 inverted Head and Shoulders base formation in YIELD that is warning about MUCH HIGHER interest rates in the not-too-distant future (beginning in 2026?).
 That said, for today's purposes, heading into the CPI data, the Monthly Chart setup argues in favor of continued downward pressure on 10-year YIELD.
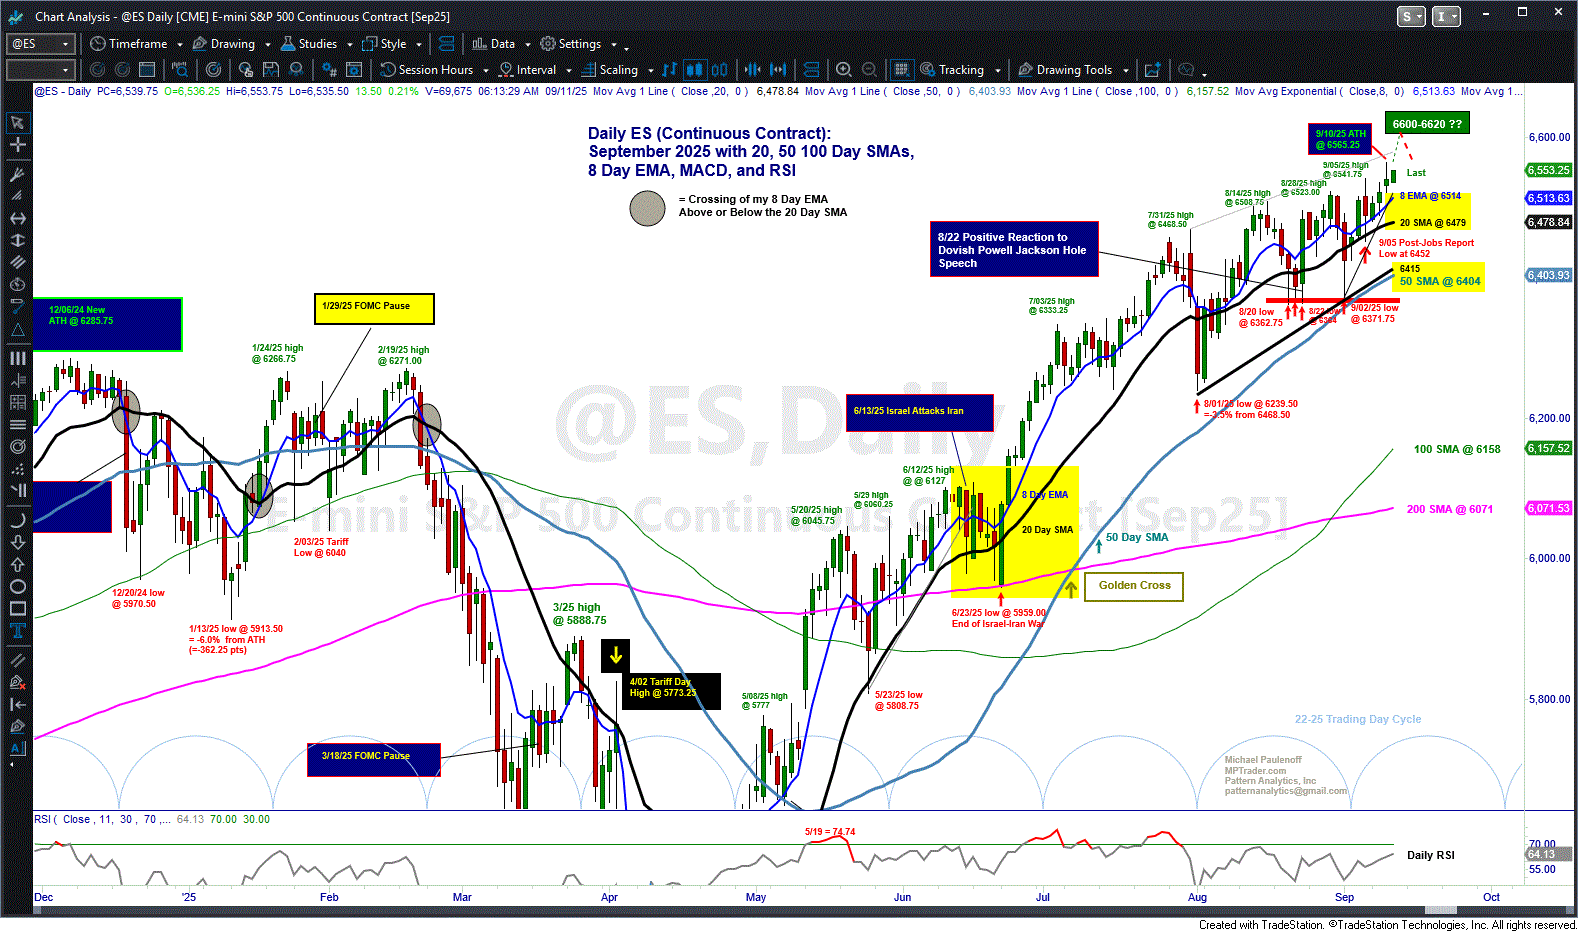
As for the Emini S&P 500, my Big Picture Daily Chart indicates that, barring a negative reaction to CPI, as long as weakness is contained within or above a key near-term support window from 6515 down to 6480, the bulls will remain in directional control, as a such, the knee-jerk downside move will be treated as a Buy-the-Dip opportunity ahead of upside continuation to new ATHs projected into the 6600-6620 target zone.
Conversely, a sustained breach of the 20 DMA, now at 6479, will trigger a near-term downside reversal signal that will point initially to 6400-6415.

