Tenuous Set-Up for IWM
 By
Mike Paulenoff
By
Mike Paulenoff
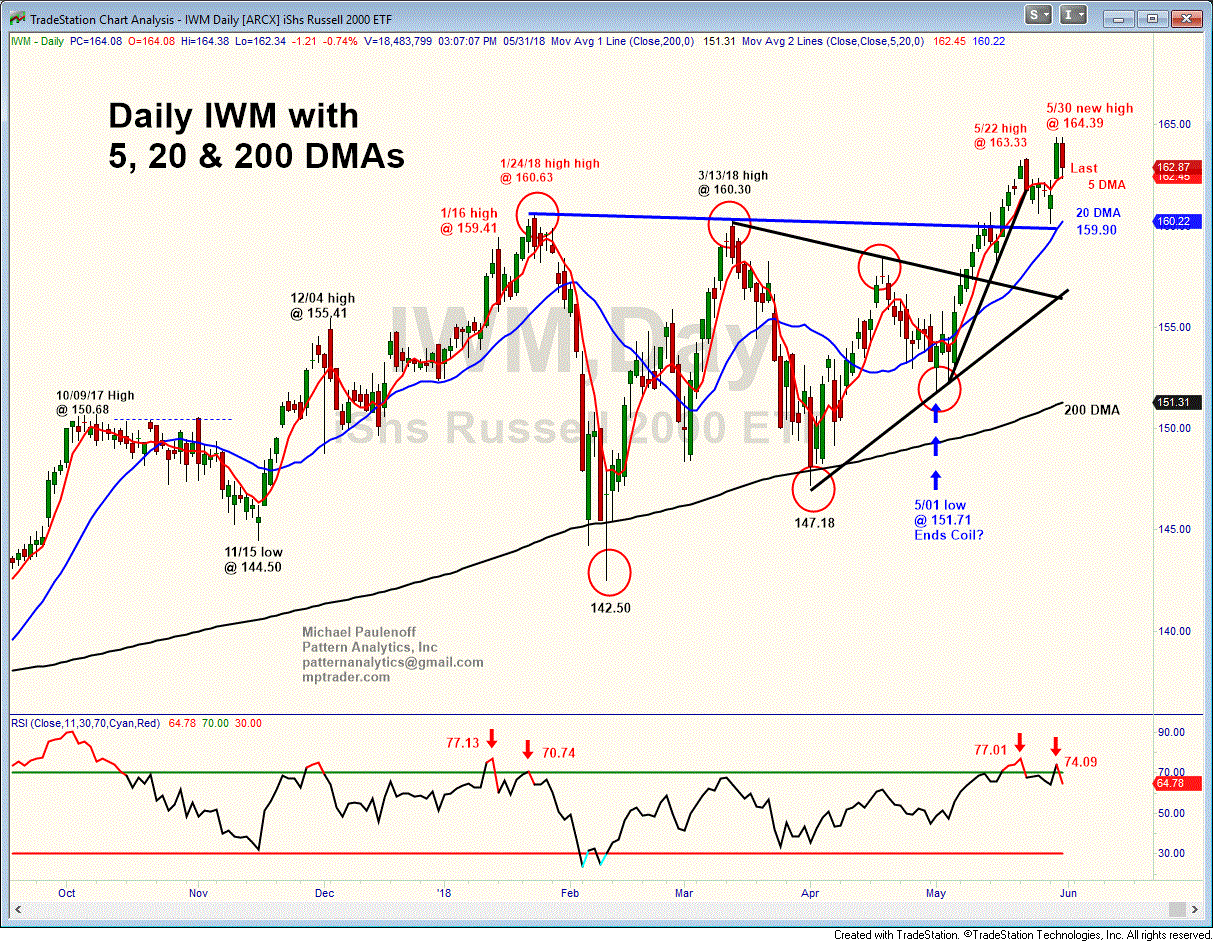
IWM-- yesterday's big recovery upmove in the major equity index ETFs after Tuesday's plunge propelled IWM to another new all-time high at 164.39, extending the upmove off of the May low at 151.71.
That is the good news..., but there is potentially bad news too.
Let's notice on the enclosed IWM daily chart that yesterday's new high and today's failure to follow-through on the upside have left behind a glaring negative momentum divergence that resembles the huge negative divergence that showed up at the mid-Jan. 2018 highs prior to plunge from 160.63 to 142.50, and the advent of the multi-month sideways Coil Formation (see attached chart).
The IWM set up here is extremely tenuous, and has potential to roll over hard in the hours and days directly ahead... Last is 162.81/82