The ES Rally Pattern is At An Important Crossroads
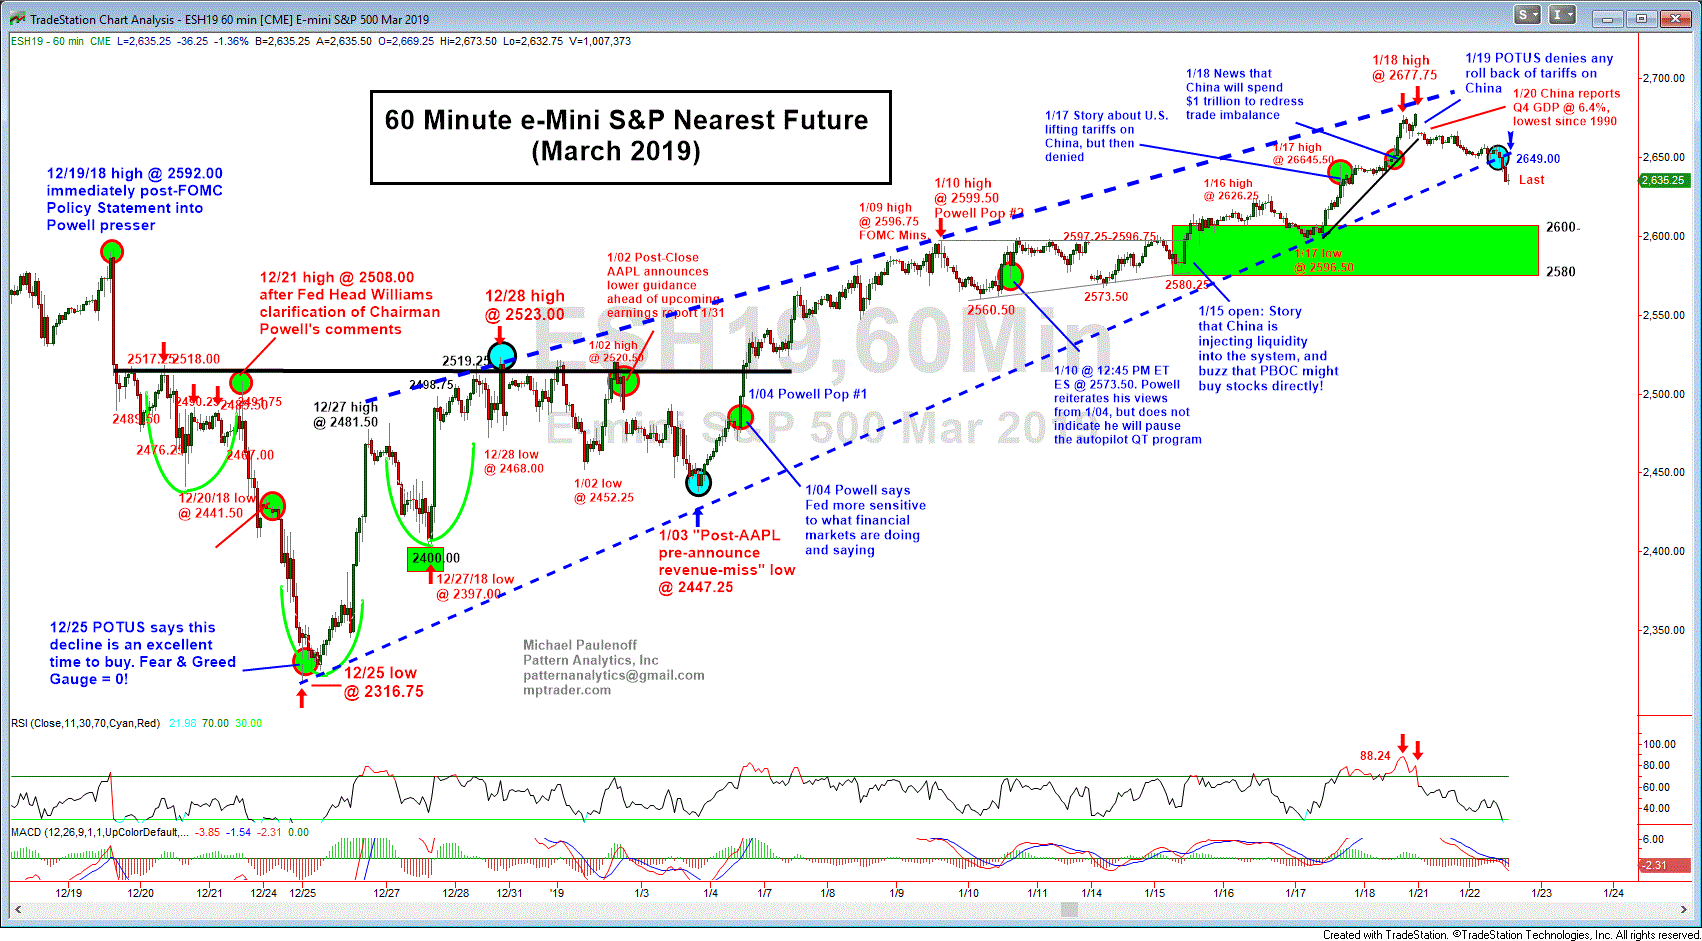
ES from my hourly pattern perspective, begs the question, "what if all of the action off of the 12/25/18 low at 2316.75 to the 1/18/19 high at 2677.75 represents a Rising Wedge Formation?"
The implications of such a pattern would indicate that the 15.6% three week advance has completed a counter-trend rally, and that the dominant downtrend is on the verge of re-emerging with a vengeance. As long as any strength in ES is contained beneath 2650/58 resistance, I cannot rule out the Rising Wedge scenario... Last is 2637.25

