The Month of May is Leaving it Technical Mark on the SPX
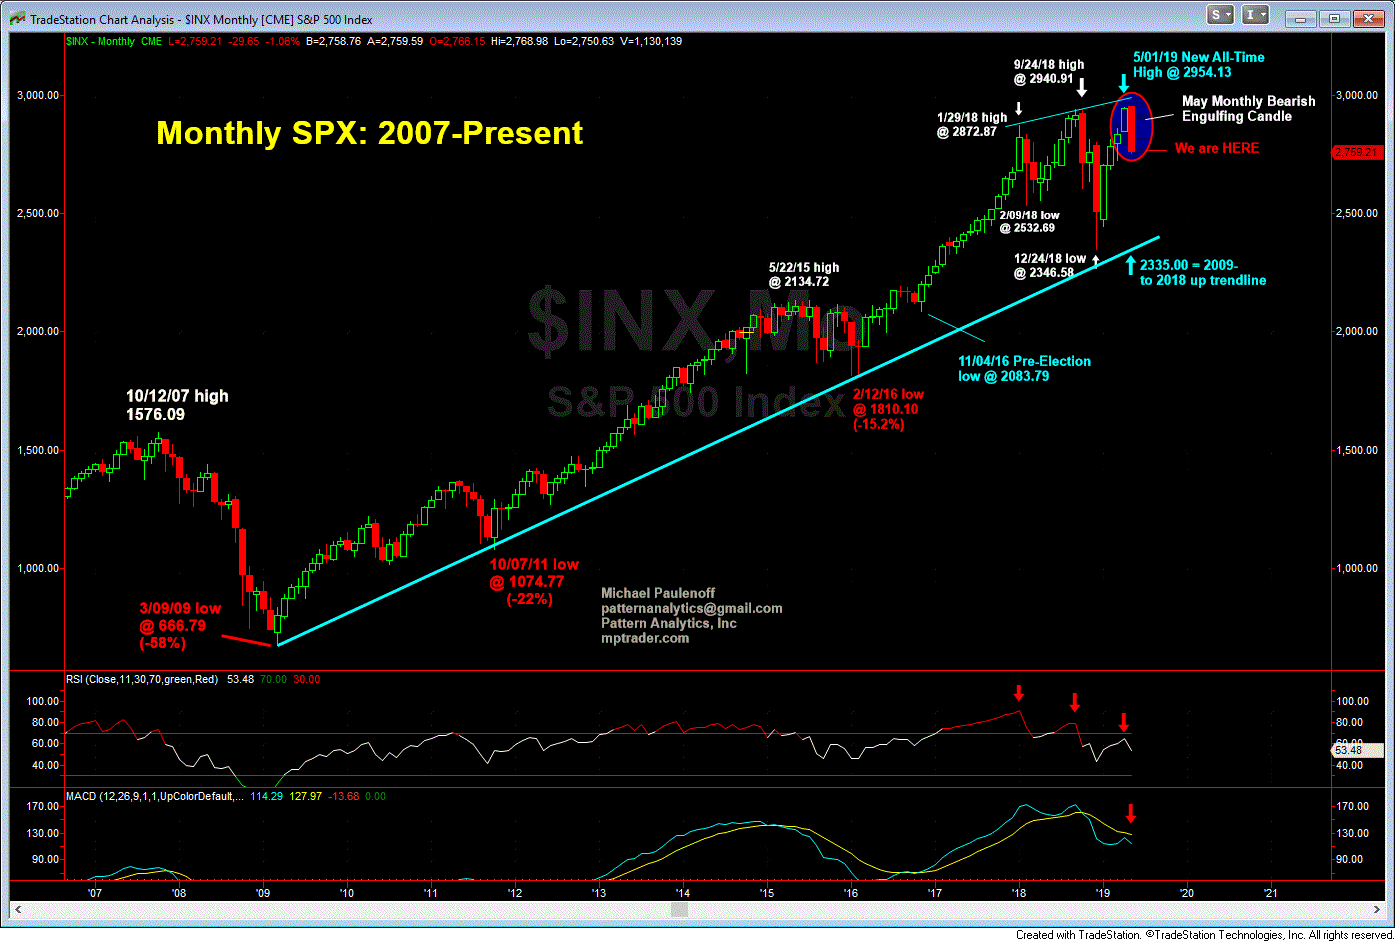
Cash SPX-- T-Minus two hours until the closing bell for the month of May. My attached MONTHLY CHART shows a MONTHLY BEARISH ENGULFING CANDLE, which at the very least, is a negative omen for the equity indices, but more than likely is a major warning signal that the May 1st, 2019 new all time high at 2954.13-- followed by a major downside reversal-- ended "something significant" on the upside, and initiated "something significant" on the downside.
In that the Bearish Engulfing Candle is accompanied by glaring MONTHLY Momentum Divergences, and a down-curling MACD, I am expecting surprises to be on the downside (in contrast to the positive surprises during the December-April period) in the days and weeks ahead. Last in SPX is 2757.50

