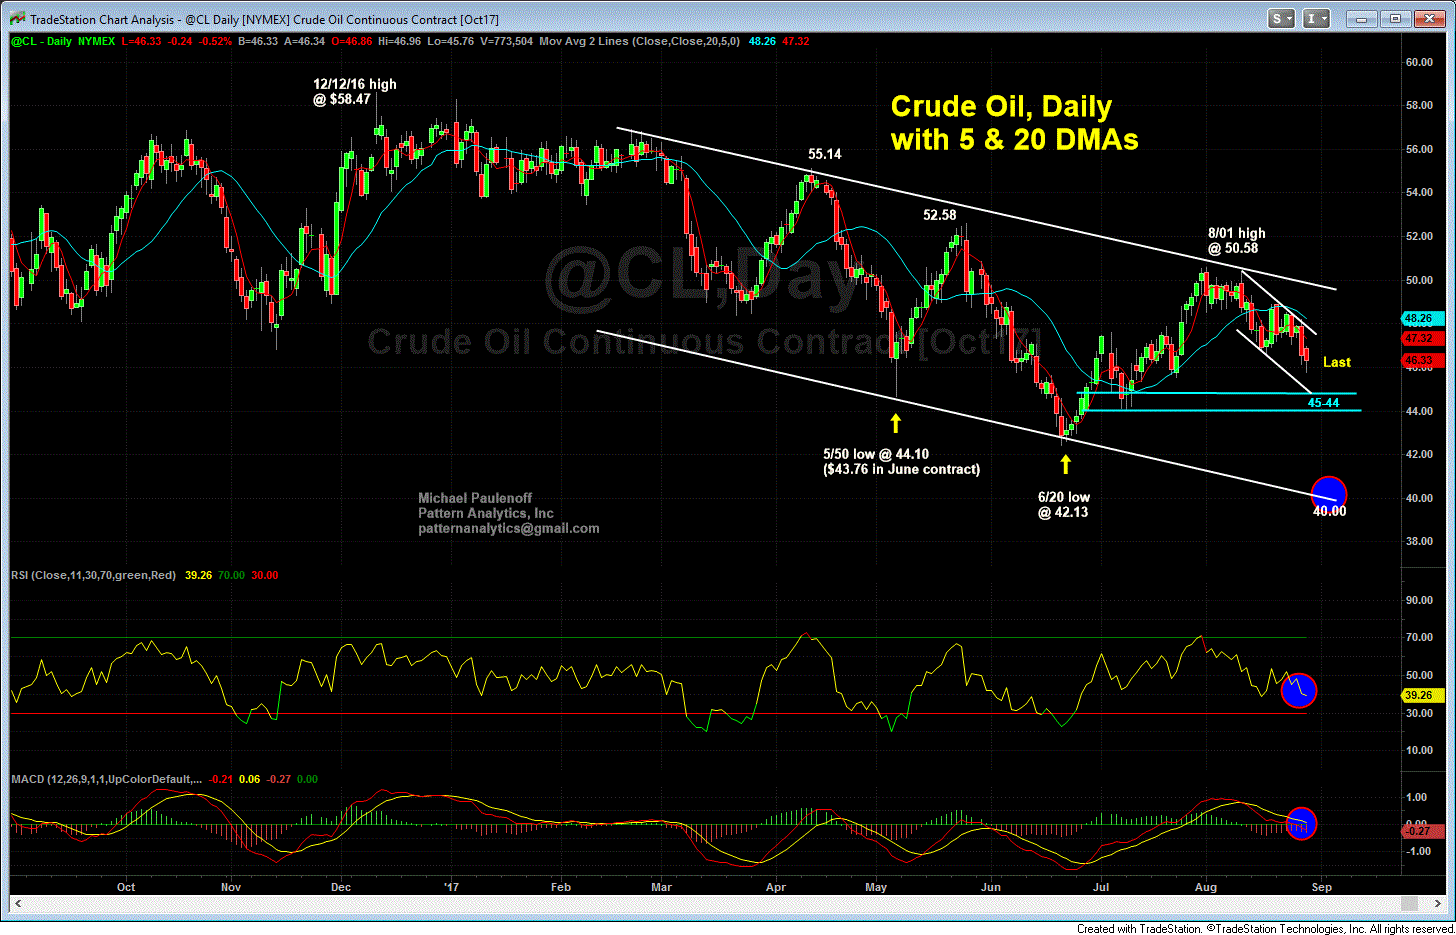
The Oil Downtrend Persists Despite Harvey and a Weaker Dollar
Crude Oil... ugh... Is it tradable? Who knows?
One look at the enclosed daily chart of nearest futures, and we can make the case that all of the action during 2017 has carved out a bearish price channel where the high and lows along the upper and lower channel boundary lines are separated by $8 to $10 swings. Off of the 8/01 high at 50.58, Oil has pressed to a low (today) at 45.76, or about half way from the top boundary line to the lower line.
Right now, my work argues that as long as Oil remains below 48.00, its path will remain "due South," towards 45.00-44.00 next, in route to 41.00-40.00 prior to the completion of the downleg that started on August 1st.
Finally, let's keep in mind that the weakness in the USD has not helped buoy Oil prices, which is a dangerous sign, especially if the Dollar manages to start a recovery rally after 9 months of weakness.

