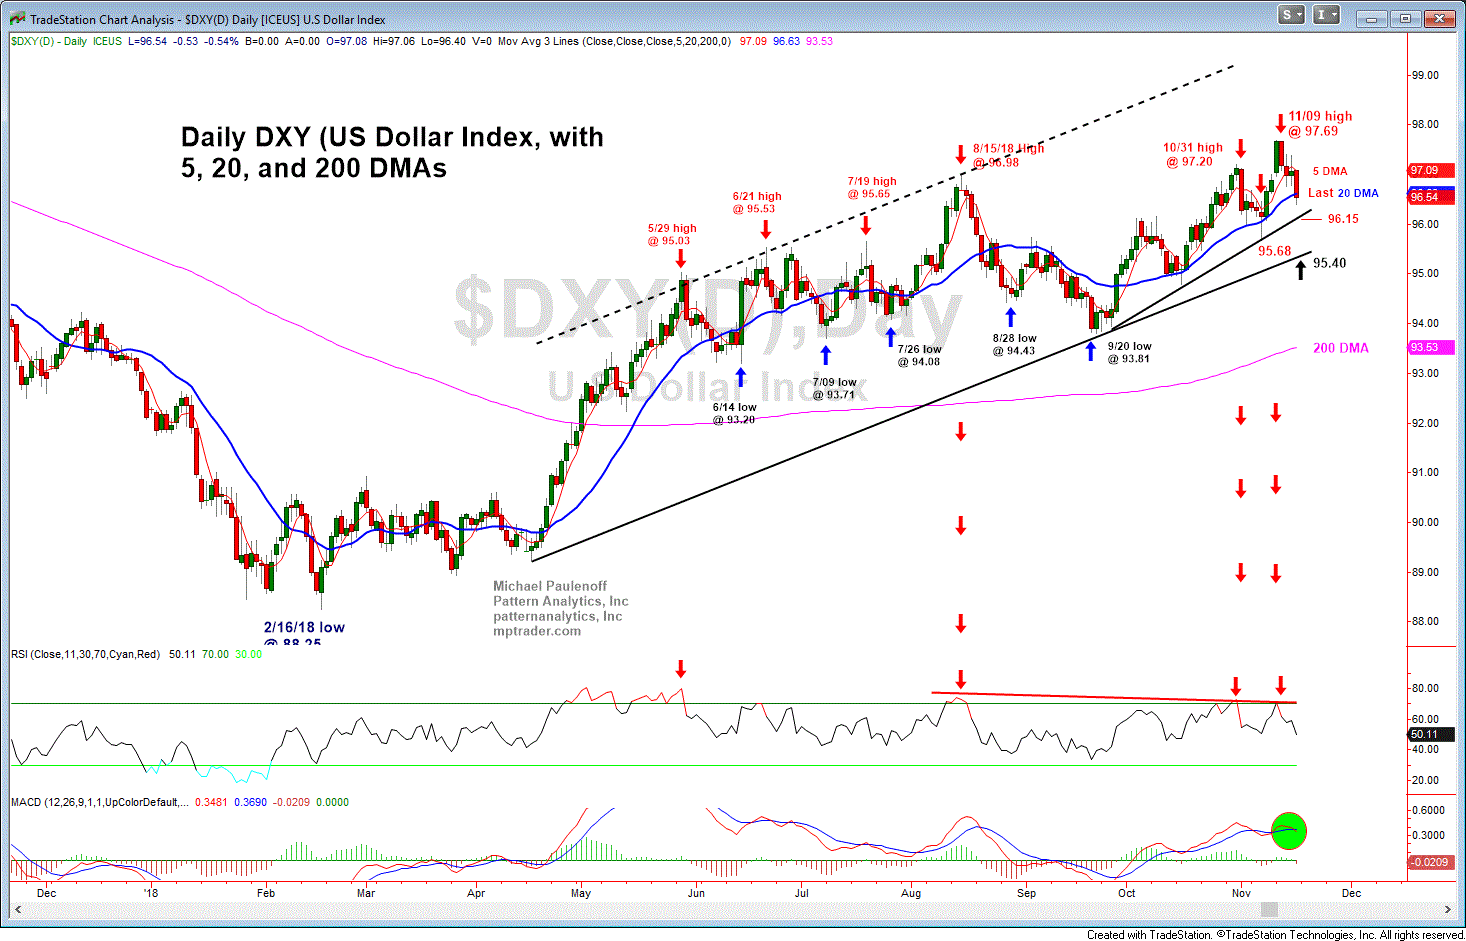
The US Dollar is Showing Signs of Technical Fatigue
On the subject of the US Dollar, using DXY as a gauge, price weakness this week from 97.69 to 96.50 comes off of a second consecutive new multi-month recovery high off of the Feb. 2016 low at 88.25 that has been accompanied by two glaring negative momentum divergences at the 10/31 and 11/09 highs (see Red Arrows on attached chart). DXY made its CONFIRMED momentum and price high at 96.98 on 8/15/18. The subsequent new recovery highs recorded lower Daily RSI readings, which represent a major technical warning signal that the Feb. 2018 to Nov. 2018 advance is at or very near to upside exhaustion, which leaves DXY vulnerable to weakness.
How much weakness? My intermediate pattern and momentum work point to a press into the 95.50 target zone, which if violated, will point to 94.20 to 93.80 thereafter.
If such a scenario unfolds in DXY, precious metals and miners will enjoy US Dollar tailwinds for change... Last in DXY is 96.49

