The USD (DXY) Exhibits Signs of a Significant Top
 By
Mike Paulenoff
By
Mike Paulenoff
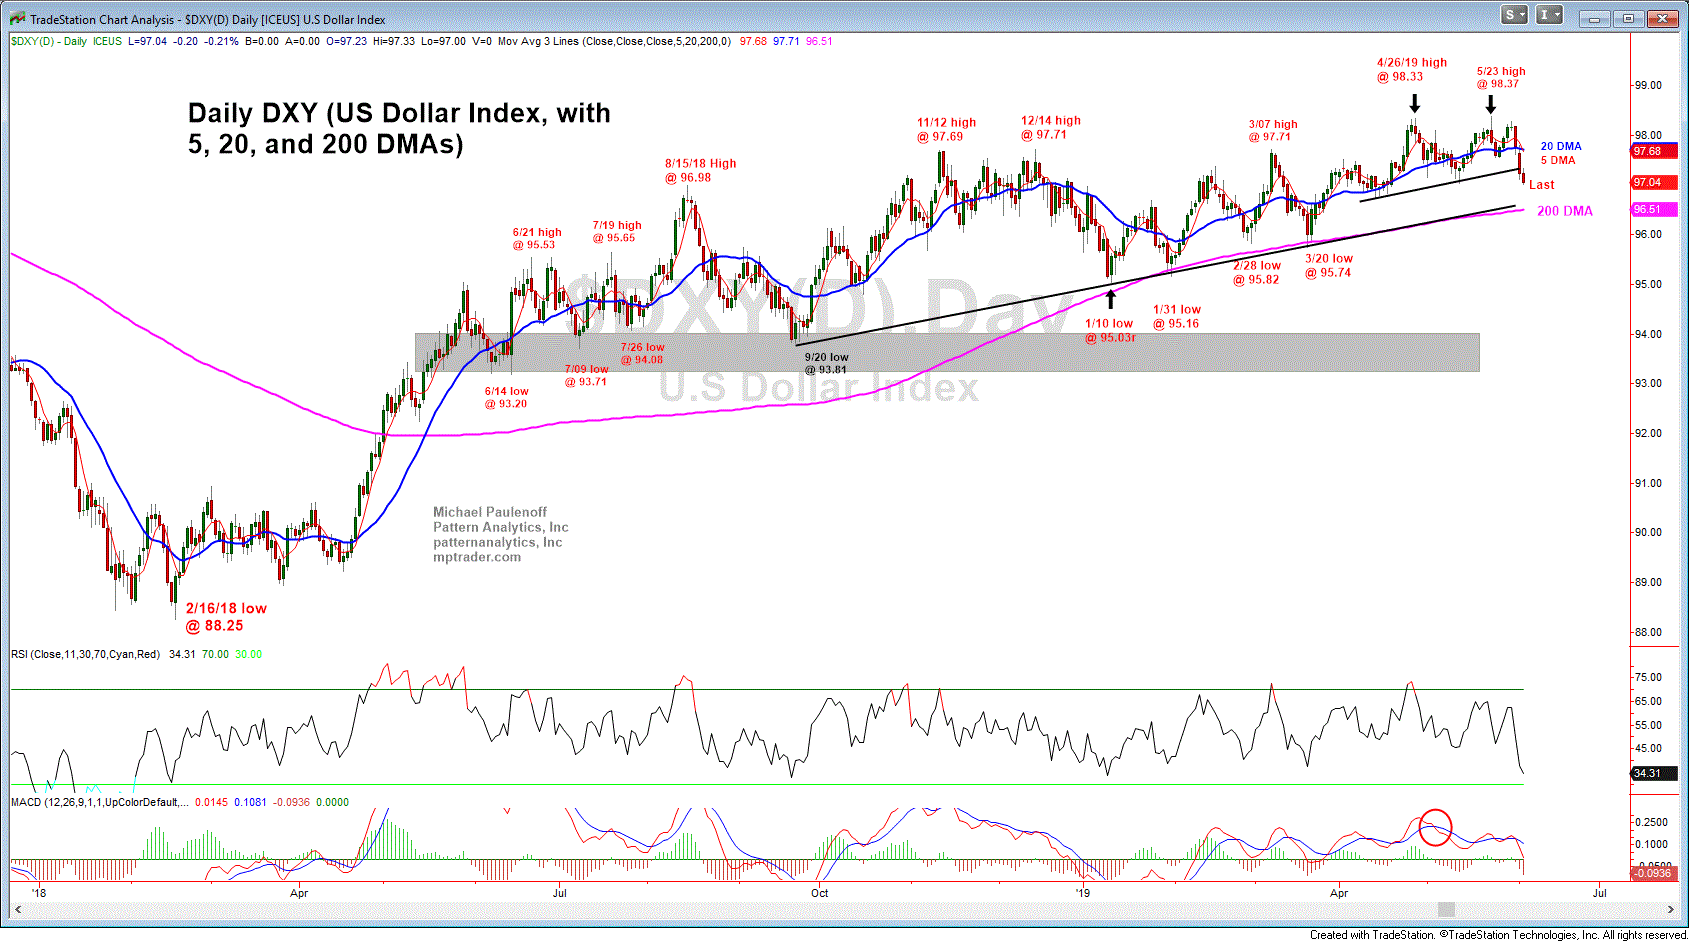
On the subject of the US Dollar, the attached chart of Dollar Index (DXY) shows intense weakness during the last three sessions, which has sliced beneath-- and triggered a negative cross of-- the 5 and 20 DMA's, and which has pressed beneath key near term support at 97.30 to 97.10. All of the action since about the third week in April has the right look of a Double Top and-or a Big "M" formation that is exerting downward pressure towards another challenge of the 200 DMA, now at 96.51.
We should not be surprised by a roll over in the USD. After all, it has been climbing since its Feb. 2018 low at 88.25 (+10.2%) amid a strong economy and a Fed "tightening" cycle. Now the Fed is worried about the economy, and lack of inflation, and tariffs, and tweets, and is sending out smoke signals that it is prepared to ease if necessary!
All eyes on DXY 96.50 for a test of the 200 DMA in the hours/days directly ahead... Last is 97.07