USD Downtrend Gaining Momentum
The US Dollar (DXY) big picture set up....
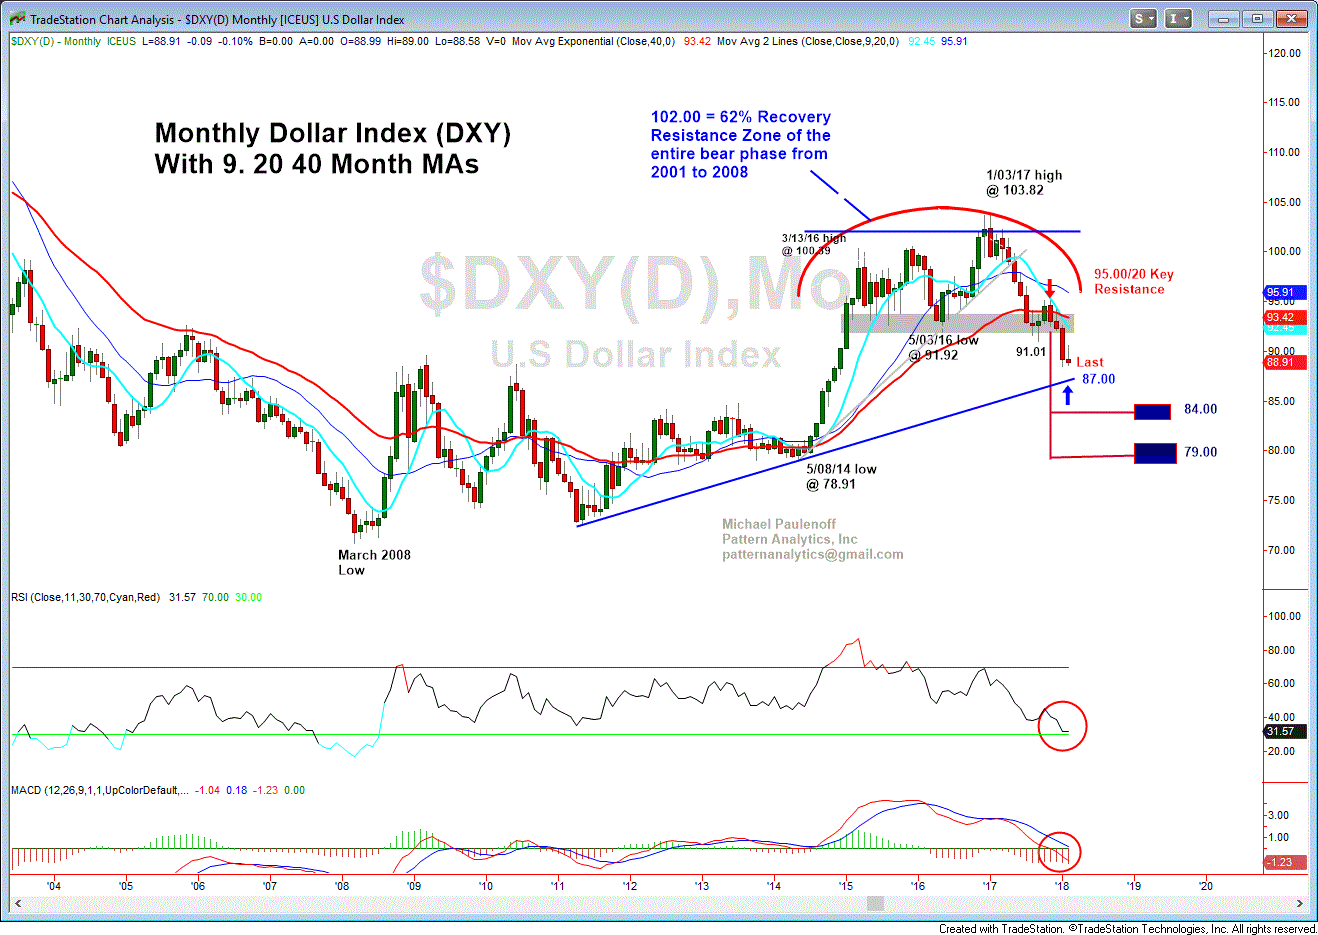
Most Dollar-watchers see the DXY universe from the perspective of chart #1, which shows the bull market off of the 2008 Financial Crisis Low (70.70) to the Jan. 2017 high, followed by a correction that has pressed to the 89 area so far, but likely in route to a challenge of the key 2008 support line in the vicinity of 87.00.
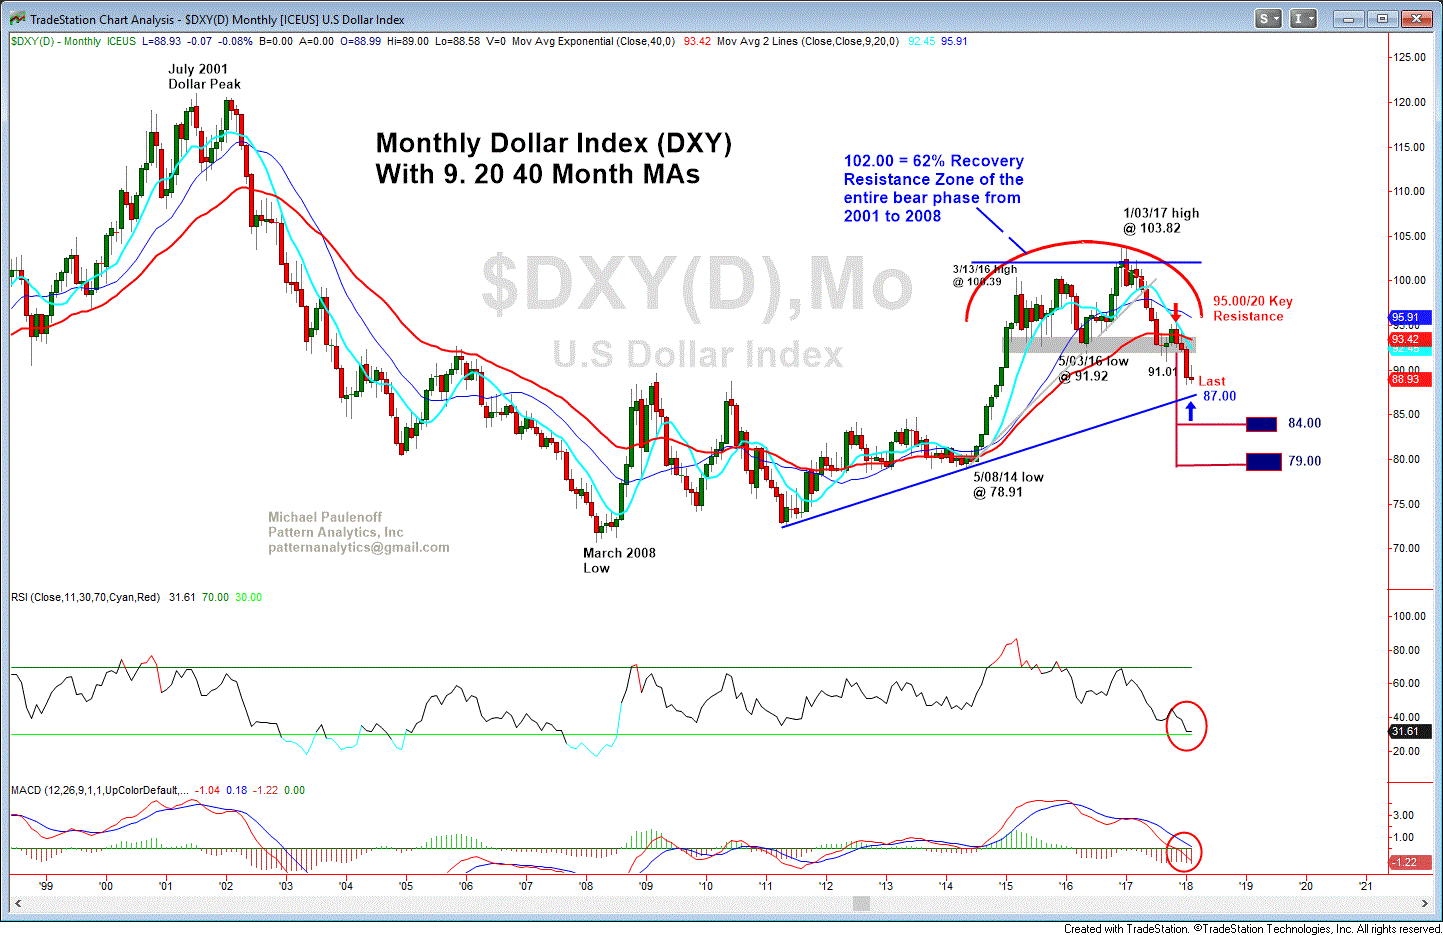
Now take a look at Chart #2, which expands the picture back to 2000, and what we see just might alter our perspective of what is going on with the US Dollar. Namely, that off of the 2001 all-time high, DXY went into a protracted downtrend into the 2008 low, and then embarked on a counter-trend advance into early 2017 that recovered 62% of the prior downleg. From the 2001 to present perspective, is it plausible that for the past 13 months that DXY has rolled over into a powerful downside continuation of its dominant larger negative trend?
The answer (in case you are wondering) is most definitely yes.
And given the Trump Administration's below-the-radar lack of support for the Dollar, Trump's obsession with +3% to 5% economic growth (literally at any cost to the deficit and debt), coupled with the Dollar's lack of responsiveness to higher rates, it certainly appears that the USD remains in the grasp of a very powerful downtrend that is gaining increasing downside momentum.


