UVXY vs ES: Which Inverted Head-and-Shoulders Set-Up Will Fail?
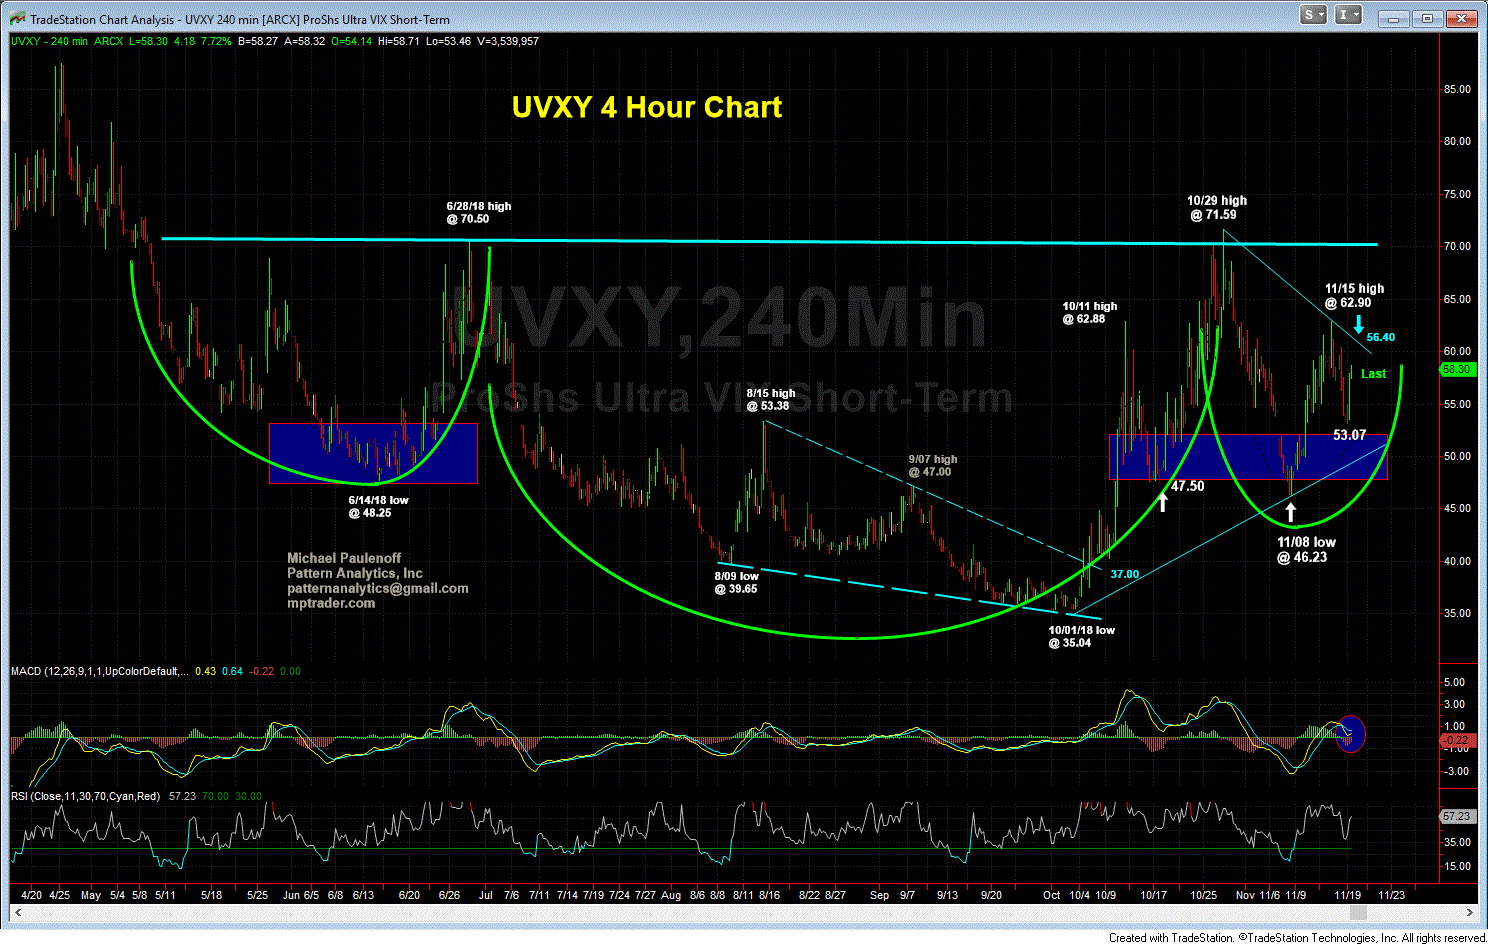
UVXY-- The OTHER Inverted Head & Shoulders Pattern-- shows Right Shoulder development and maturity (see attached chart), as the price structure climbs from last week's pullback low at 46.23 to today's high at 58.93, pushing up towards a retest of the prior rally high at 62.90 on 11/15.
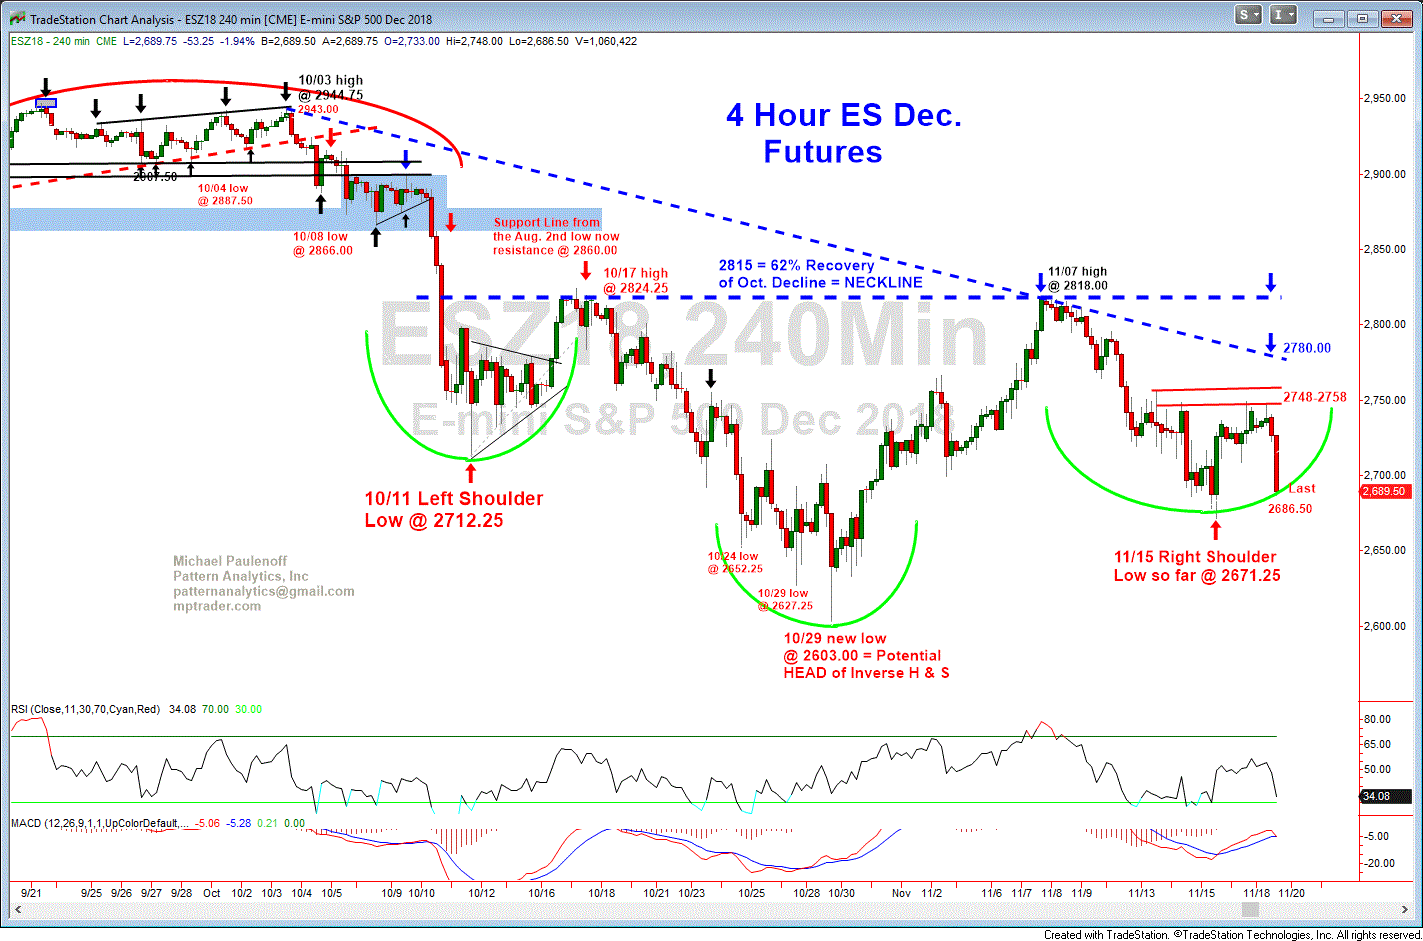
Compare that chart with the attached ES IHS chart.
BOTH OF THESE SET-UPS CANNOT EMERGE ON THE UPSIDE. One of these markets will be wrong, and its IHS set up will fail miserably.
As of this moment, I have considerably more confidence in the UVXY set-up climbing towards the 70.60-71.50 "Neckline" Resistance Zone ahead of a potentially explosive UVXY upmove (remember Feb?), and my confidence level will increase if ES declines and sustains beneath its 11/15 "Right Shoulder" low at 2671.25...
Last in UVXY is 58.30/35... Last in ES is 2696.50


