Upside Exhaustion Ahead?
 By
Mike Paulenoff
By
Mike Paulenoff
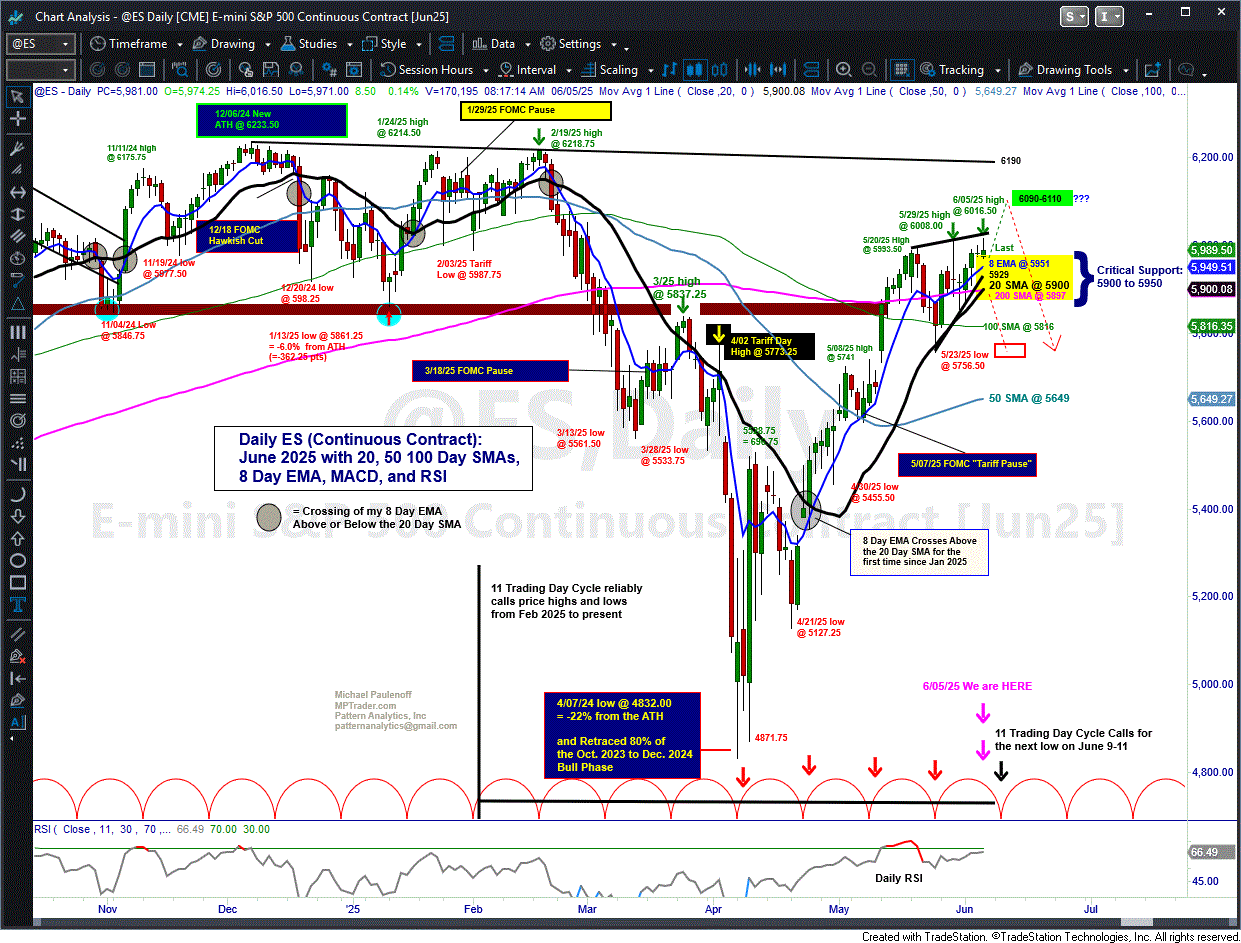
ES-- I am getting worried. My attached Big Picture Daily Chart of ES shows today's pop to a new post-April new high at 6016.50, but the new high resides within what looks like a developing Rising Wedge Formation (see thick black demarcation lines atop the April-June upleg).
A Rising Wedge Formation usually precedes a condition of upside exhaustion and is the final "bullish" formation within a mature uptrend pattern. If this setup turns out to be true to form, then ES still has some upside work to do into new post-April high territory above today's high at 6016.50 that could reach my next optimal target zone of 6090 to 6110 before the risks of a nasty downside reversal elevate significantly .
That said, any forthcoming higher-high above 6016.50 (to 6100) is "fair game" for a pattern reversal to the downside.
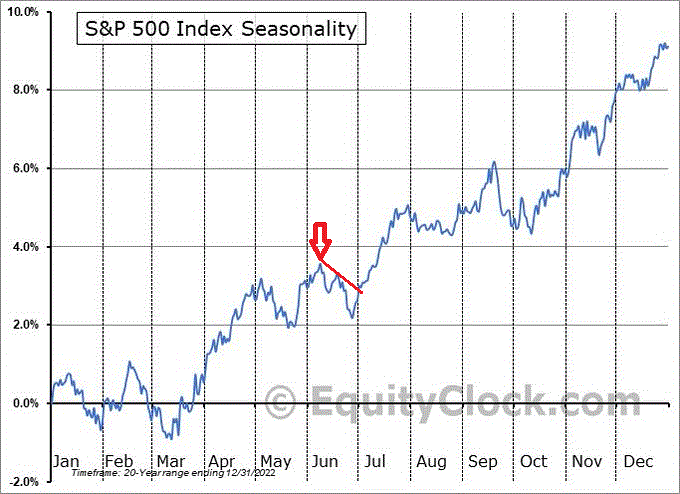
If I add my near-term cycle work and June seasonality into the mix (see cycle work on my Daily Chart and the SPX Seasonality Chart below the ES Chart), both argue for price weakness starting next Monday or Tuesday (but it could emerge after tomorrow's reaction to the Jobs Report)...
Lastly, from a strict technical (PRICE) perspective, the bulls will remain in directional control unless and until a bout of weakness slices beneath support lodged between 5950 down through 5900 (the Yellow Box on my ES Chart)...
Bottom Line: My pattern and timing work are warning me about a potentially damaging scenario that will emerge in the hours/days directly ahead...