Upside Targets After Powell's "Dovish" Comments
Good Thursday Morning, MPTraders! March 21, 2024-- Pre-Market Update: The Day After the FOMC Meeting where the voting Members appear to be concerned about sticky inflation amid resilient economic and labor market growth, but which Powell repeatedly dismissed, convinced that the Fed's 2% target level will be met in the upcoming months, leaving the pundits to label yesterday's interpretation of current and forthcoming Fed policy as Dovish!
Of course, THAT was and is music to the ears of the equity, bond, and commodity markets...
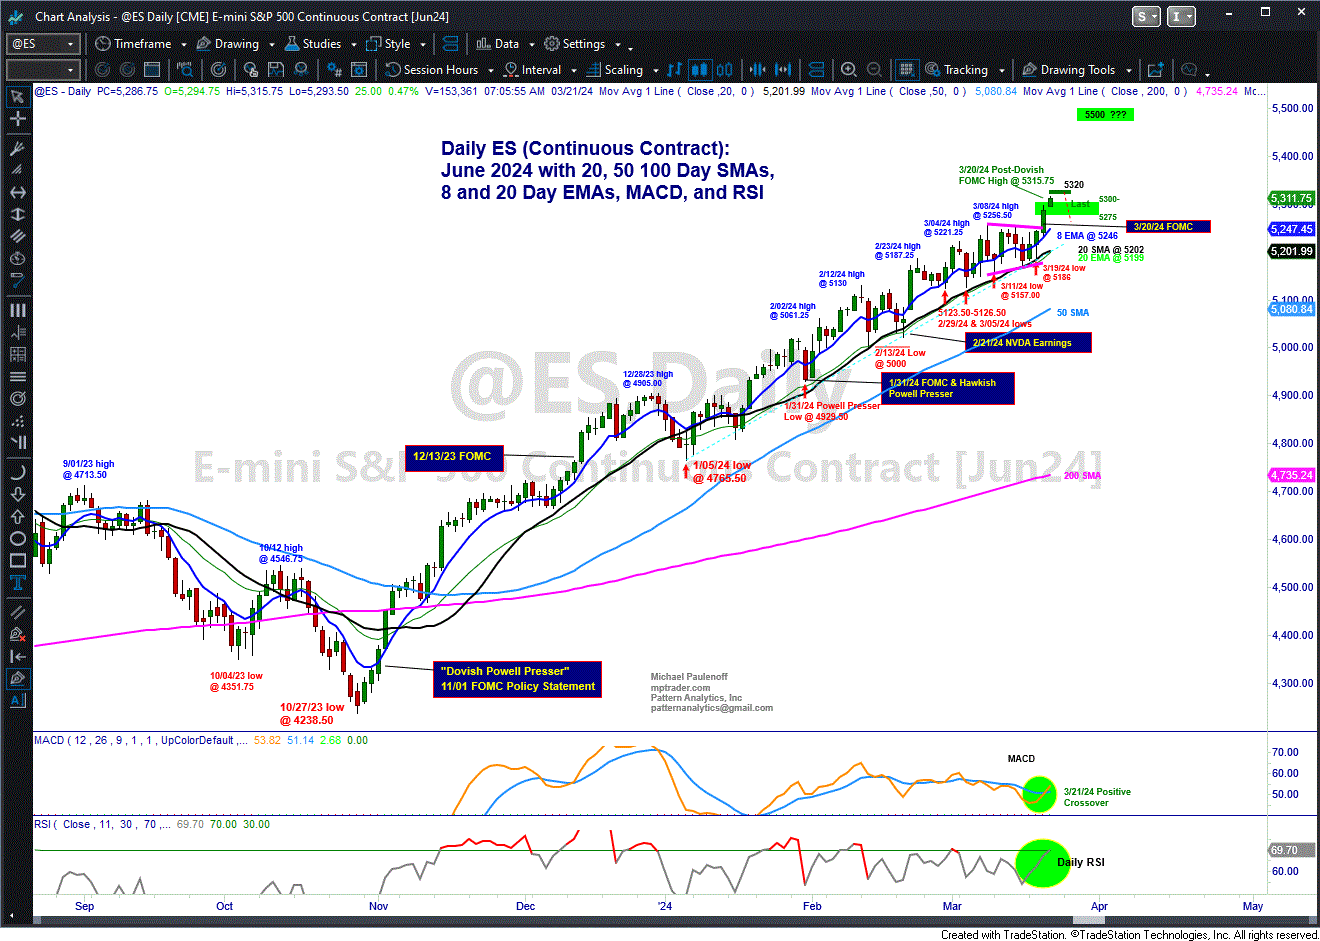
From the perspective of the equity indices (ES), my attached Big Picture Daily chart shows the post-October 2023 advance in all of its trend- following glory (higher-highs and higher-lows) the integrity of which will be maintained unless and until the 3/19/24 low at 5186.00 is violated.
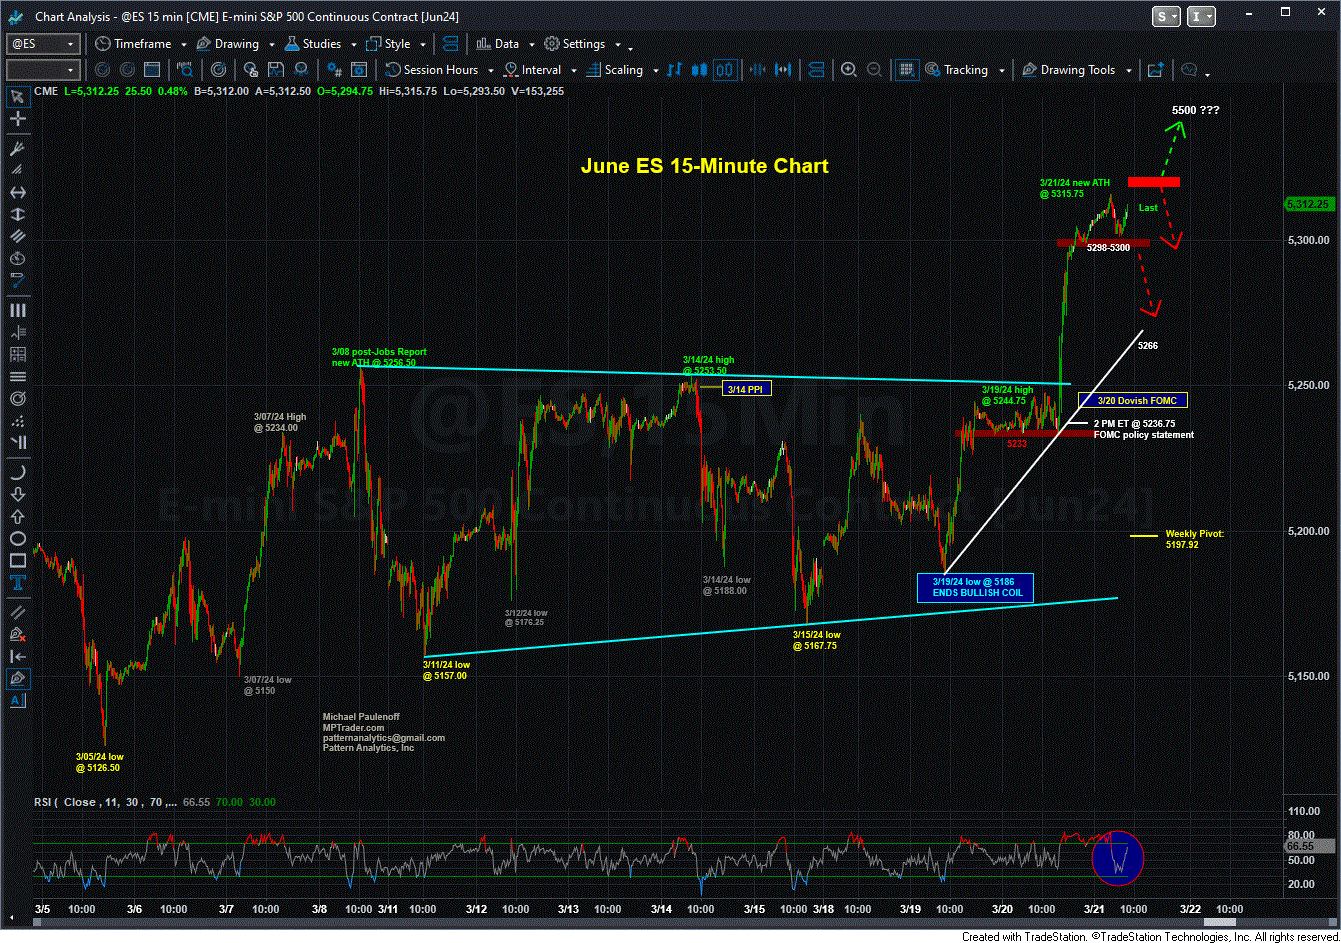
On the flip side, the $64,000 question from my pattern work is whether the thrust off of Tuesday's (3/19/24) low at 5186 to this AM's high at 5315.75 is the "final upmove" of the larger advance, or the initiation of a vertical, parabolic blow-off type of finale' to the post-October 2023 bull phase?
Both my Big Picture and my attached nearer-term 15 Minute Chart argue from a pattern perspective that the ability of ES to climb and sustain above 5320 (yes, less than 5 points above the current price level) greatly increases the likelihood of upside continuation and acceleration (believe it or not!).
I will be focused on the behavior of ES if and when it takes out 5320. The gray area will be between 5320 and 5360 (0.8% above my 5320 optimal target level), from where my pattern setup from 5186 will be looking for signs of upside exhaustion and downside reversal price action.
After 5320 is met and/or hurdled, weakness thereafter that breaks 5298-5300 micro support will trigger an initial warning signal that "something ended," but to confirm that a correction is in progress, ES will need to press lower through support from 5265 to 5250, which if violated, will confirm the reversal and press toward a test of critical major up trendline support at 5186.00.
In the absence of a sustained pullback of significance from above 5320, i.e., beneath 5298 for starters-- ES will be heading toward 5360 next, the high boundary of the 5320-5360 gray area that if taken out will project to 5500. Last is 5313.50...


