WMT As A Possible Leading Indicator
Good Thursday Morning, MPTraders! August 17, 2023-- Pre-Market Update: WMT Earnings, and WMT as a leading indicator? Jobless Claims at 8:30 AM ET... Two full sessions ahead into August OPEX...
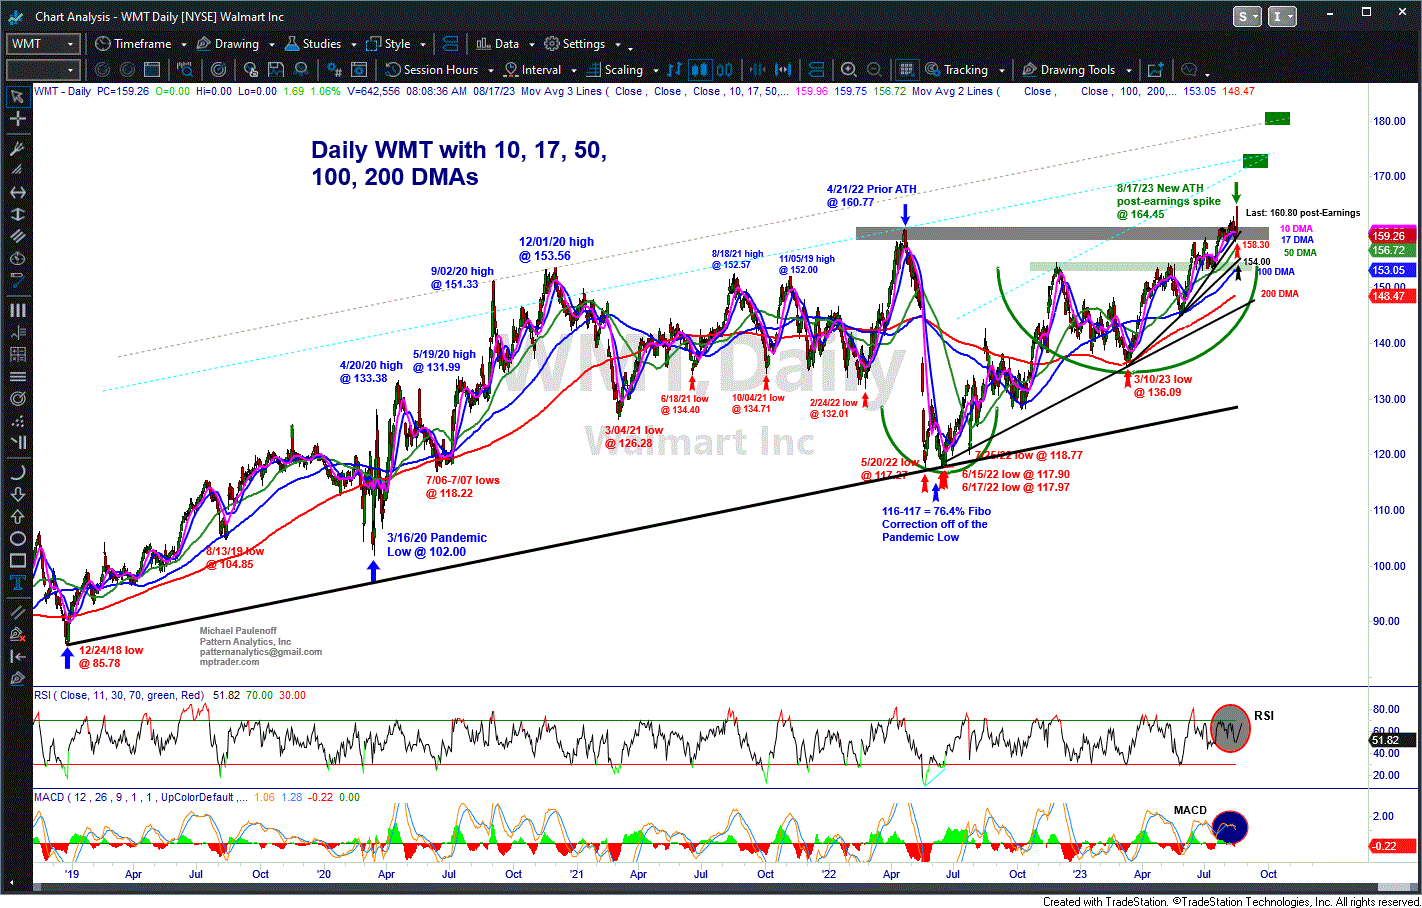
WMT released earnings this AM. The mega-cap retailer beat The Street's estimates on EPS and Revenues, beat on comp Same-Store-Sales metrics, and guided in-line (quite a different report than TGT's earnings reported yesterday). In reaction to the report, WMT spiked higher to an All Time New High at 164.45 (that's right, a new ATH). My attached Daily Chart shows the powerful pattern that developed in WMT off of its October 2022 and March 2023 lows (those timeframes should ring a bell-- SPX) that propelled WMT to and now above its April 2021 prior ATH at 160.77.
As long as any forthcoming weakness is contained above 158.30 initially, and absolutely above 154.00, which will establish a potentially powerful Double Top formation, my intermediate-term pattern and momentum setup argues for still higher prices that project to 173.50-175.00 and possibly to 180.00 in the weeks and months ahead.
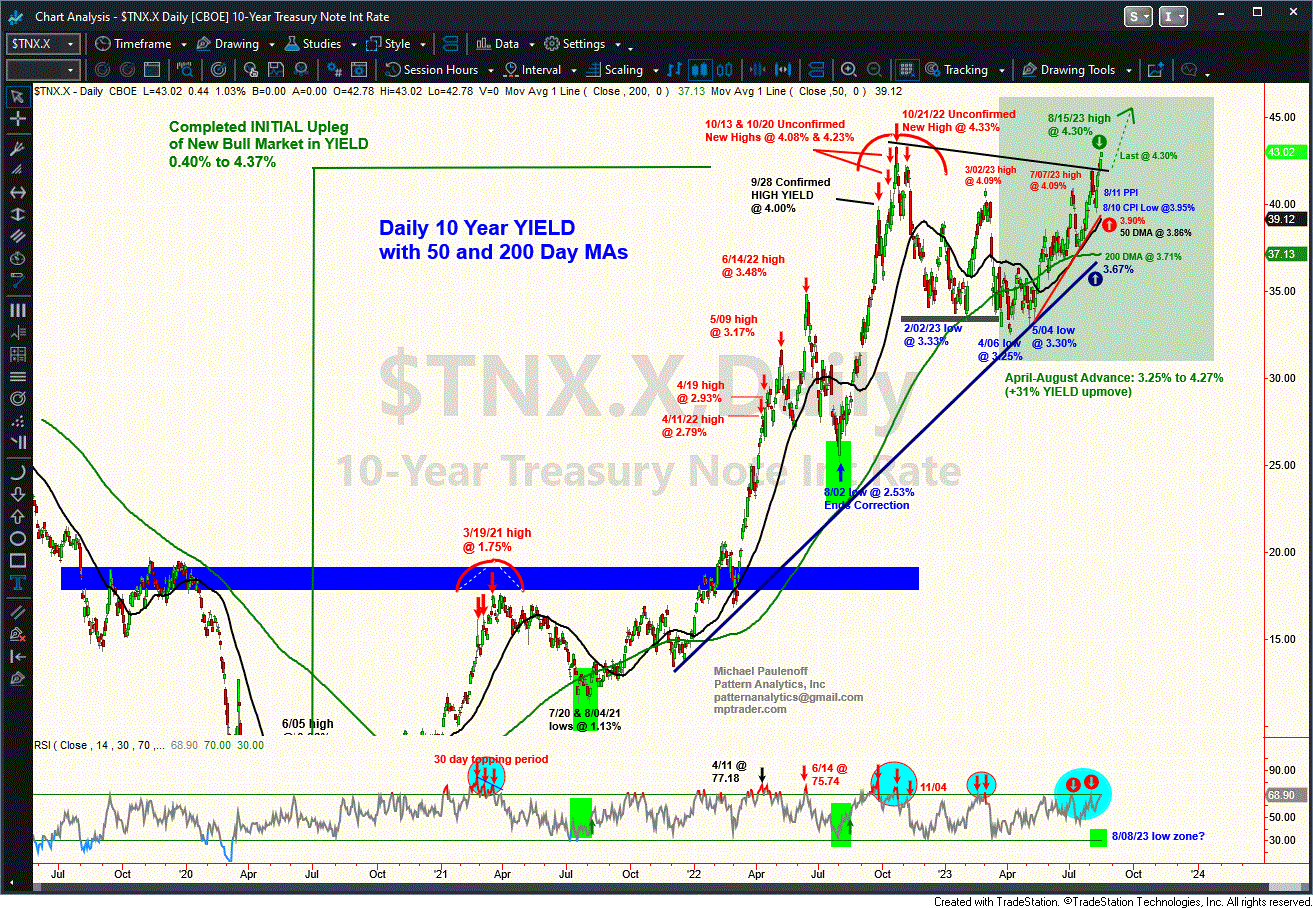
Perhaps the setup in WMT and its implications for a relatively strong-- maybe a stronger-than-expected consumer and overall US economy in the upcoming weeks and months are foretelling upside continuation in benchmark long bond YIELD? Benchmark YIELD hit an intraday high at 4.30% so far (see my attached Daily Chart) just beneath last October's intraday high at 4.33%, which if taken out and sustained, adds "technical confidence" to higher projections pointing toward 5.00-5.25% not so far up the road... Last in WMT is 158.50 off of a spike high at 164.45... Last in YIELD is 4.29%...
ES next...


