What Now Technically For AMZN?
 By
Mike Paulenoff
By
Mike Paulenoff
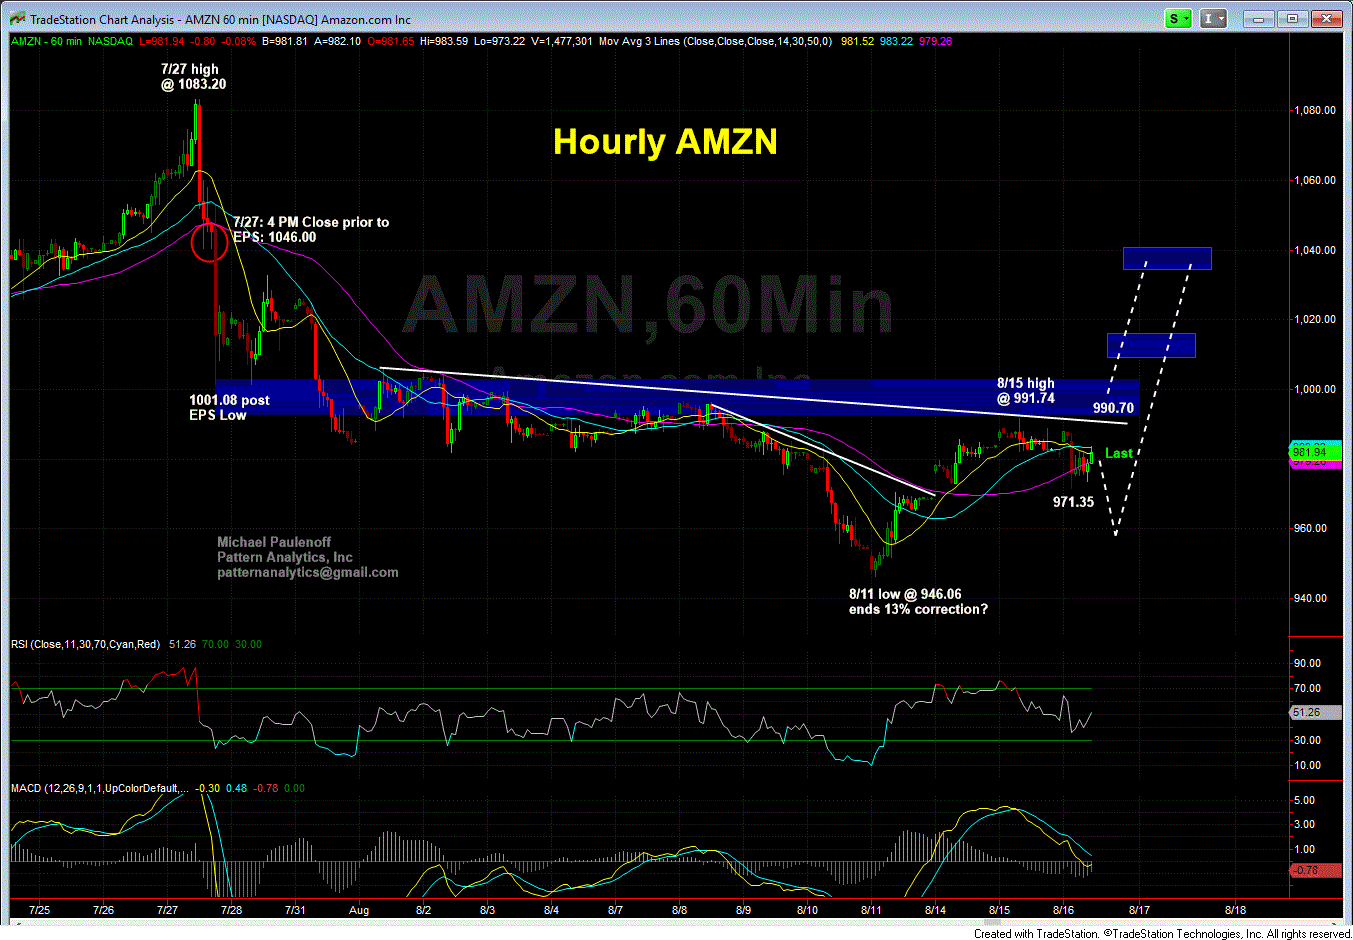
AMZN-- the structure of the decline from the all time high at 1083.20 (7/27/17 just prior to earnings were released) to the 946.05 low (8/11/17) has the right look of a completed correction. In addition, the rally off of the 946.05 low to yest.'s (8/15/17) high at 991.74 exhibits bullish form, which warns us that there is more recovery upside ahead, that challenges heavy resistance between 990 and 997, which if hurdled and sustained, will trigger upside projections to 1012-1018 and then to 1030-1040. The structure of that upmove, should it emerge, will provide us with important information as to whether the strength is a new upleg or a recovery rally in AMZN.
For the time being, my work expects the emergence of more recovery strength, either in progress now, or after another bout of pullback weakness into the 965-960 area, from where I will be expecting an upside reversal signal that the next upleg is starting