What Now Technically for TSLA?
TSLA-- One reason I steer away from overlaying my technical work on TSLA is because all aspects of the set up are messy-- the fundamentals, valuation, management, production expectations, and chart pattern, all engender a broad spectrum of opinions. Even the car itself elicits all sorts of reactions (mostly positive from the people I know who own or lease one).
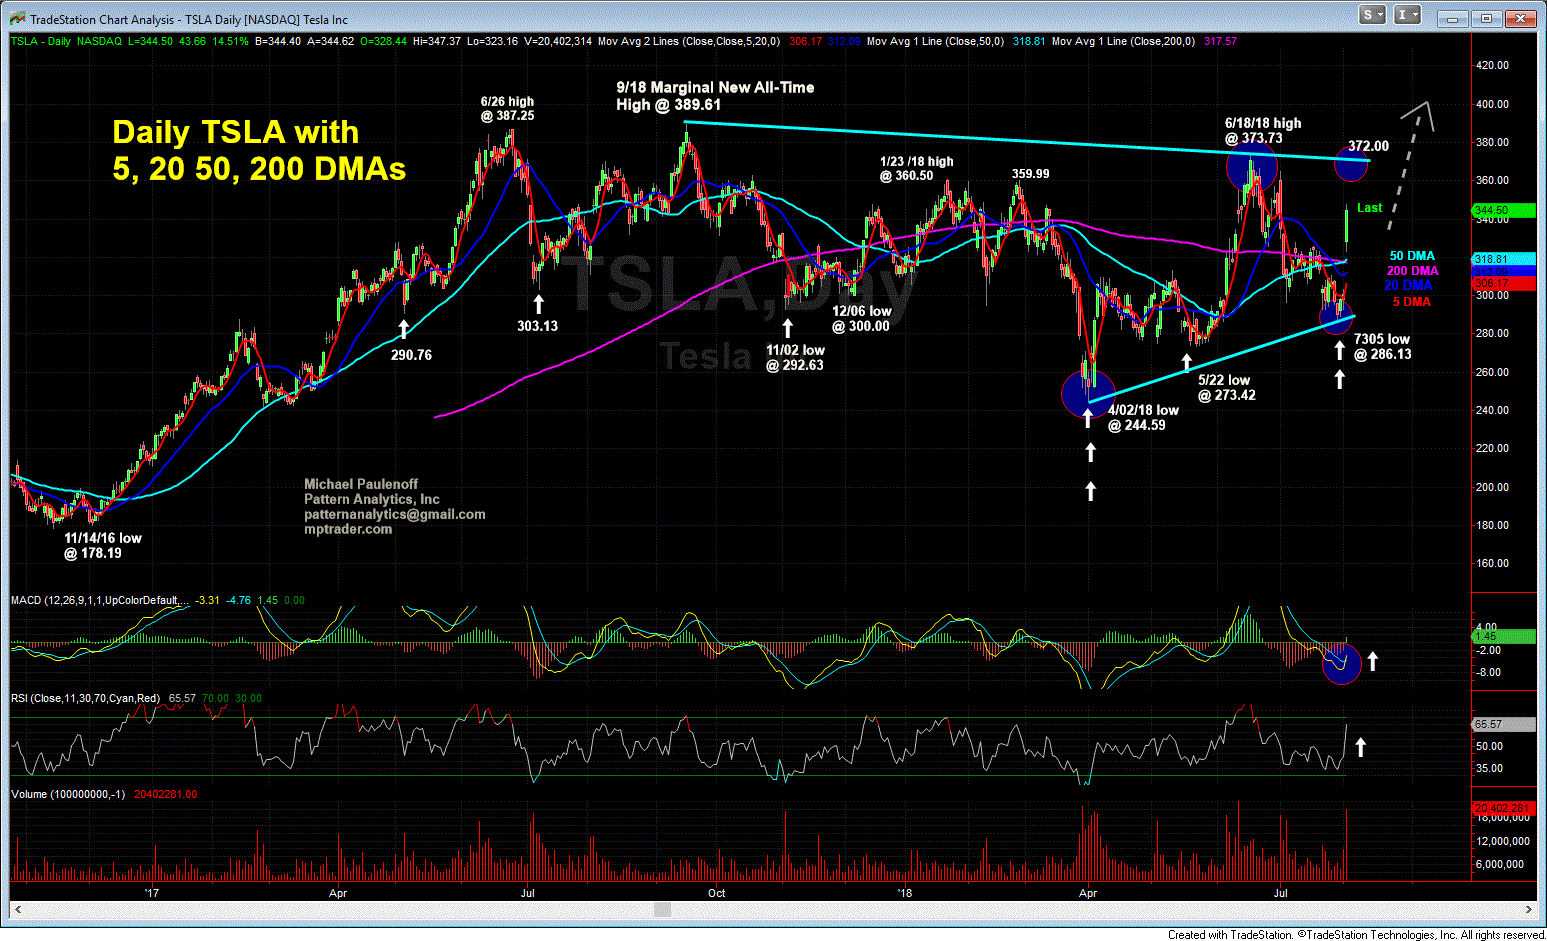
One look at my updated daily chart shows just how messy TSLA has been since its all-time high at 389.61 on 9/18/17. Can we agree that TSLA has carved out an 11-month sideways, contracting price pattern? Yesterday at this time, TSLA looked like it was threatening to break the lower side of the pattern, but instead, Musk managed to pull a rabbit out of his hat (again?), which stunned the substantial short position that covered and raced the stock up 15% in less than 24 hours. Ouch!.
Be that as it may, TSLA still remains in the grasp of the multi-month sideways pattern, but certainly has the accompanying very positive daily Momentum gauges aligned for still higher prices in the hours ahead. The upper Coil boundary line cuts across the price axis in the vicinity of 372.00, and should put a lid on this post-EPS thrust-- if the large Coil structure is to remain viable, in which case, TSLA should stall and reverse back towards the mid-point of the Coil, around 315/20.
However, if TSLA blows through 372.00-374.00, then we will have to consider that the 11 month Coil-digestion period is complete, and has resolved itself to the upside into a new, powerful upleg that represents a continuation of the larger bull phase off of the Feb. 2016 low at 141.05, and will project to a minimum upside target zone of 435-445. Last is 348.25/50

